Insights Reports

Discover how your fleet is really performing

Simple, graphical reports that bring clarity to fleet data
Graphic visualisations of key fleet data
Track utilisation trends across the fleet
Compare different teams and resources
Support sustainability with emissions insights
Talk to an expert today
We're happy to answer any questions you might have and help you find the right solution. Fill out the form below and we'll be in touch shortly. 

Taking the hard work out of data analysis

Smartrak’s solutions capture a wealth of information about your fleet and assets. But mining that data and uncovering insights that drive decision-making can be challenging. If you or your team struggle to consistently analyse this information, you’ll miss out on the actionable knowledge that will assist future decision-making.
Our Insights Reporting platform is the answer. This collection of reporting modules presents your fleet data in an easy-to-understand visual format. Now, the hard work has been done for you. All that’s left is to filter and drill down on the areas of your fleet that need examining. It’s never been easier to identify trends, pinpoint opportunities, and gain insights for smarter and more efficient fleet management.

Our customers

Fleet Utilisation Insights

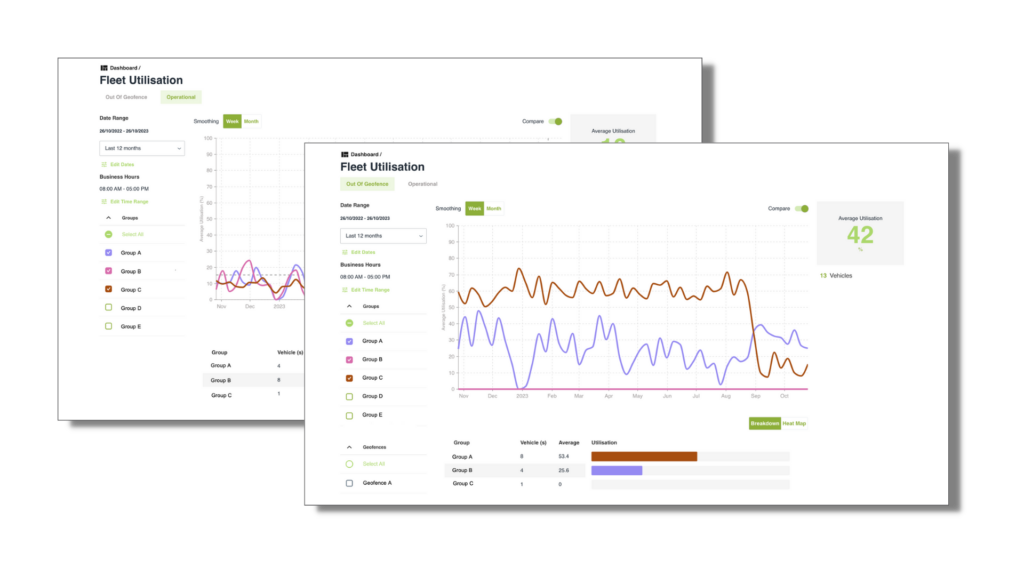
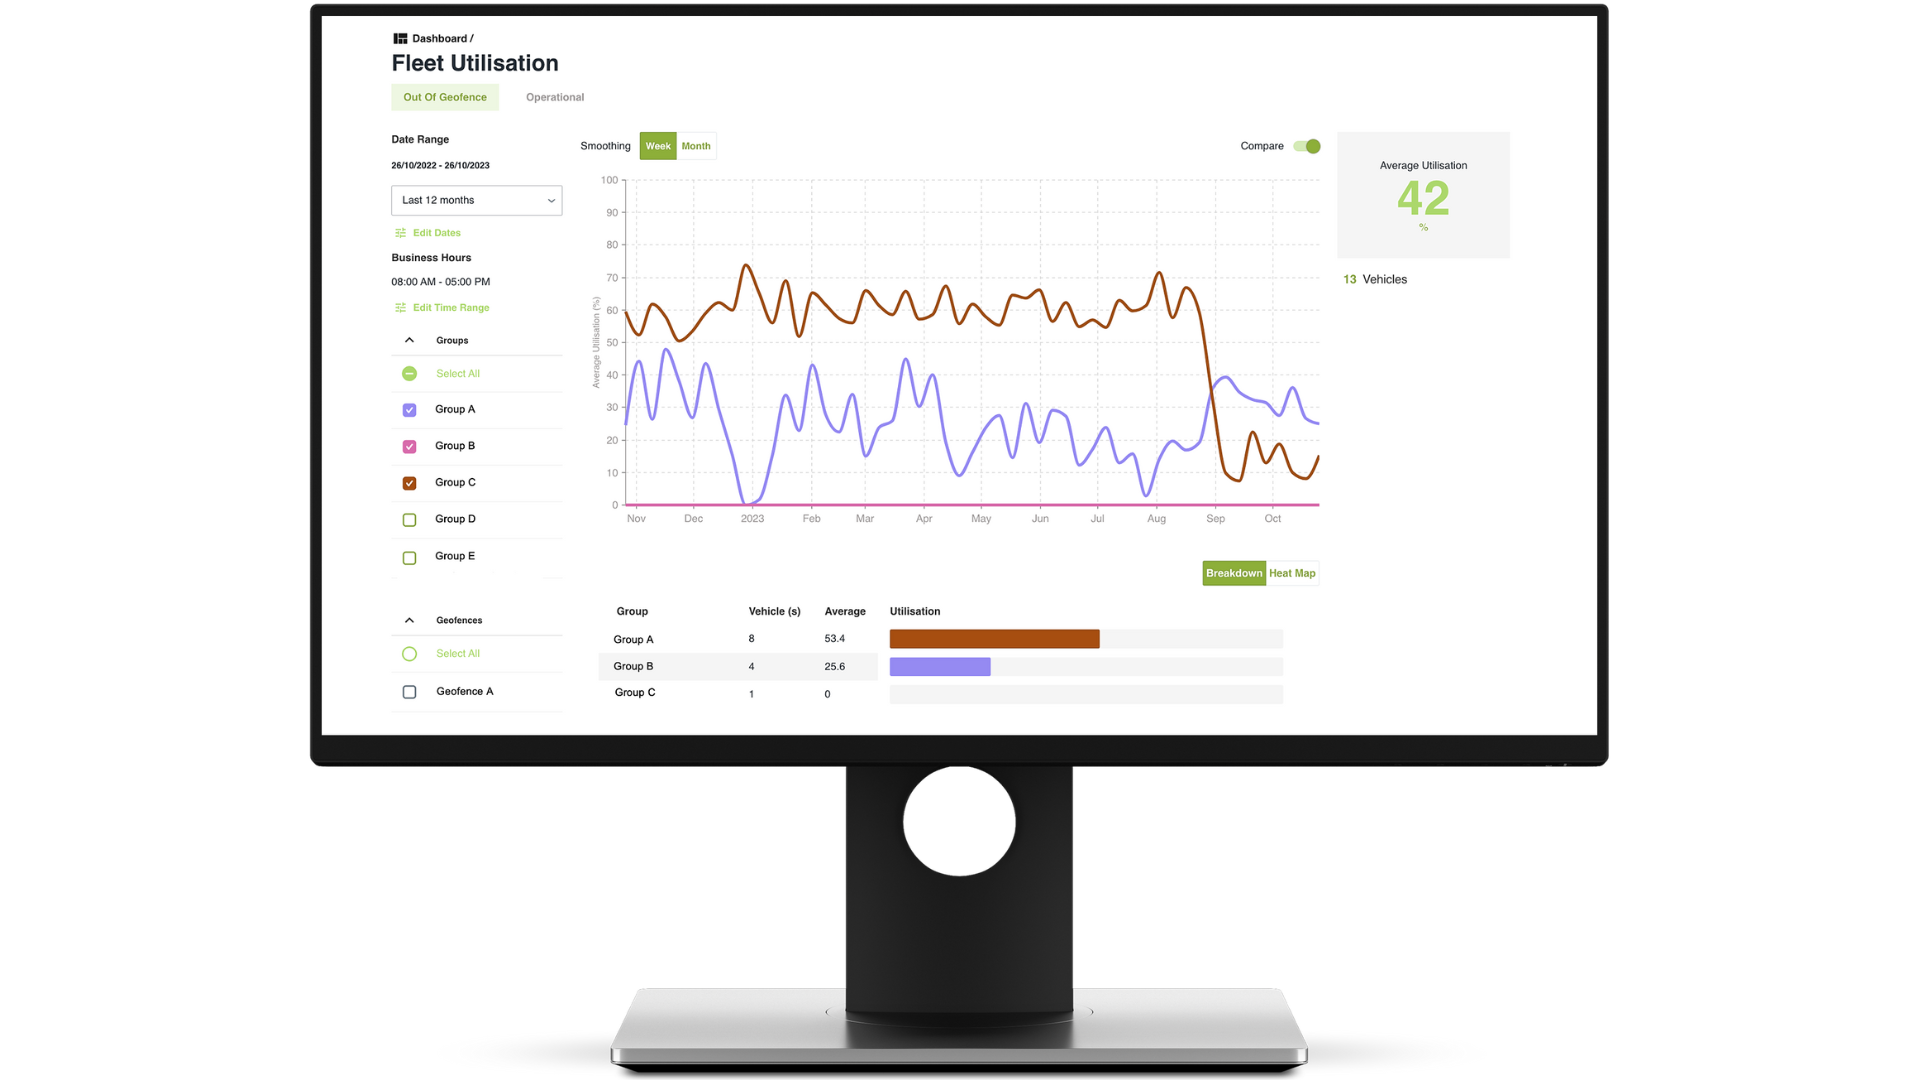
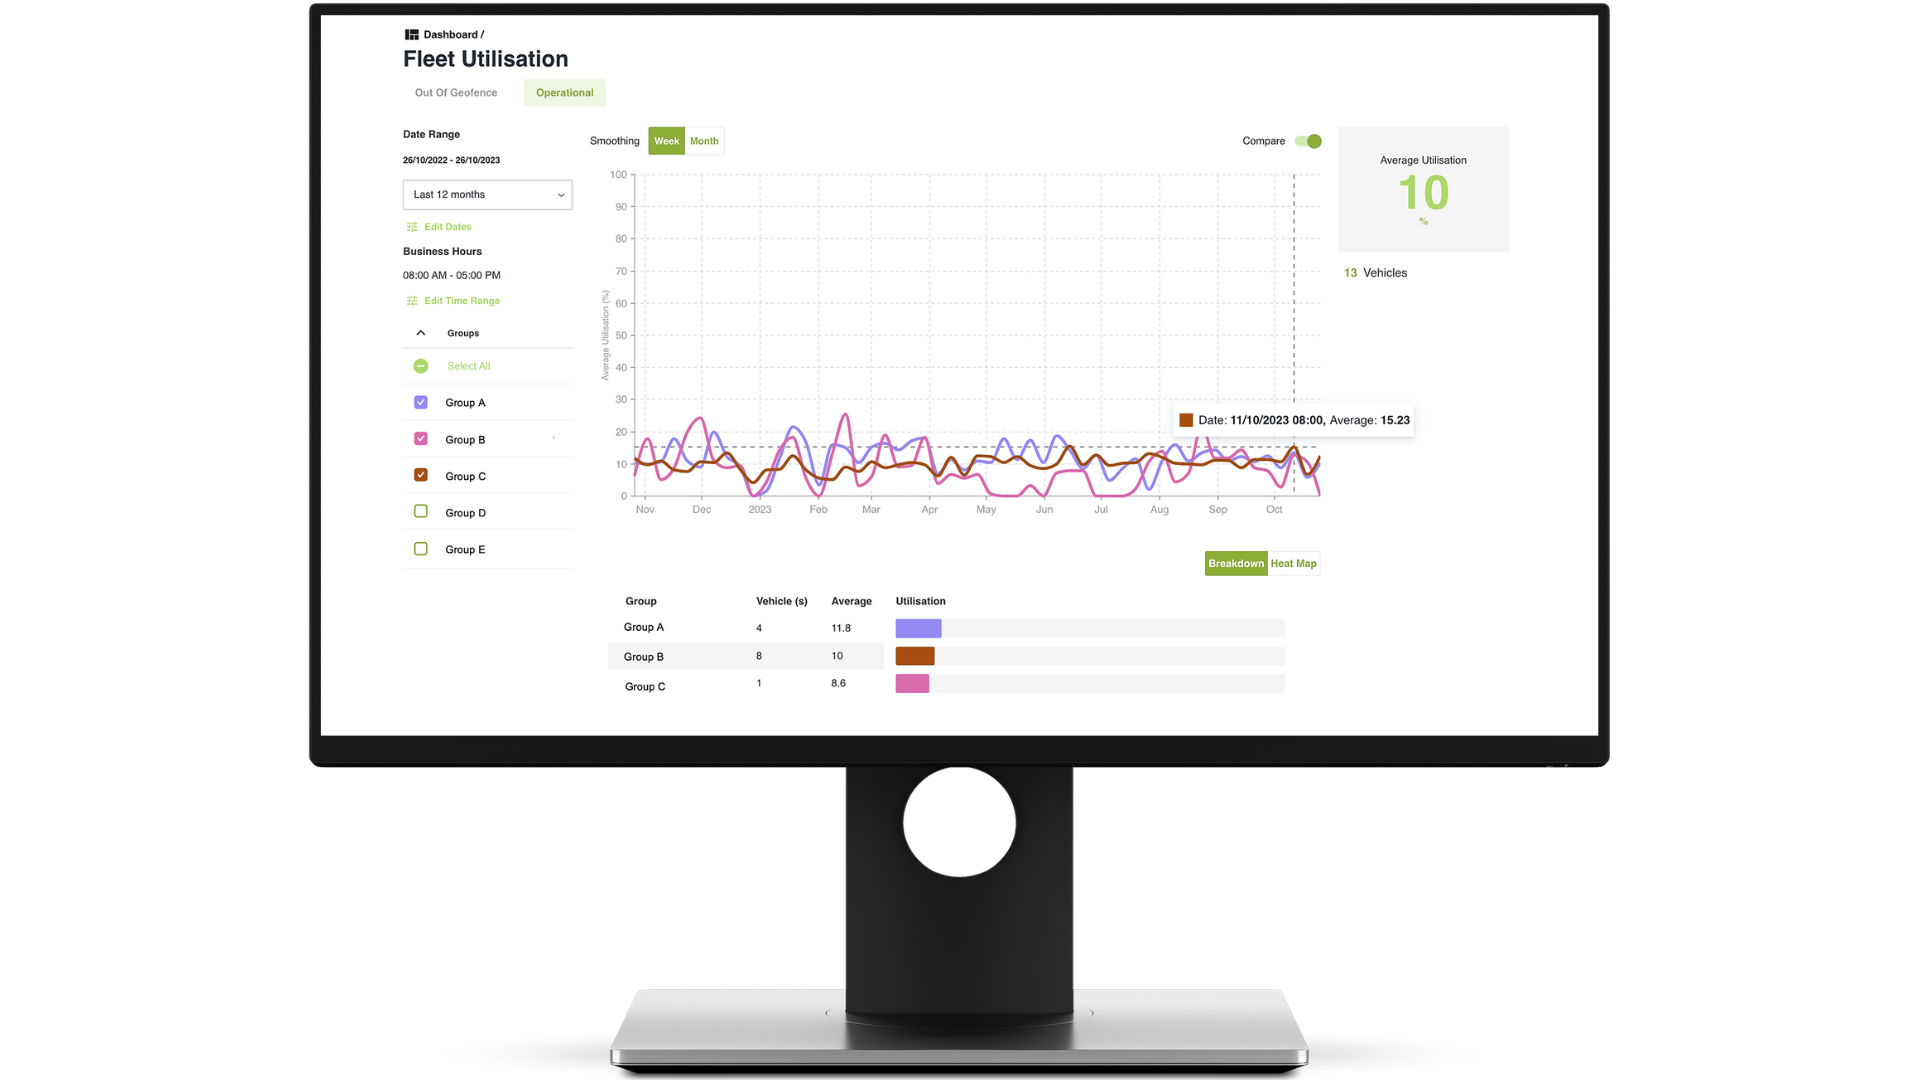
The Utilisation Insights report empowers Fleet Managers to track and analyse the efficiency of fleets, pools, and even individual vehicles. Discover usage patterns, identify underutilised assets, and streamline operations. Armed with these insights, you can optimise your fleet's size and composition, leading to reduced costs and improved productivity.

Sustainability Insights

Our Sustainability Insights report unlocks the tools Fleet Managers need to not only monitor but also report on fleet emissions. With detailed emissions data and customisable reports, you can easily detect high-emissions vehicles and identify candidates for EV transition.

Sustainability Insights will give you a clear understanding of your fleet's environmental impact. Now you can start making informed decisions about your fleet that align with your organisation’s sustainability goals.
And once you’ve made the transition, the dedicated EV insights tab will allow you to track and manage your entire EV fleet. At a single glance see the current status of each and every EV, their battery percentage, available range, and current charging status.

Discover how your fleet is performing

Geofence Utilisation
Operational Utilisation
Emissions Profile
EV Fleet Insights

Out-Of-Geofence Utilisation Insights

The Geofence Utilisation Insights report provides a top-level snapshot of how your vehicles are being utilised. The report shows the time a vehicle spends outside its "home" geofence and is a perfect first step for Fleet Managers to understand overall fleet utilisation.

A simple click provides a graphical analysis of weekly, monthly, and annual utilisation trends, as reported by your geofences.

Customise the report by including only the geofences you require to assess either your entire fleet or individual site performance. Fine-tune the reporting periods to reflect your operational day – it’s all easy.

Operational Utilisation Insights

The Operational Utilisation report fills in the gaps by reporting on activity beyond the visibility of your defined geofences. This is a complementary report to the geofence report that helps to build comprehensive visibility of fleet operations.

The feature-rich Operational Utilisation Report offers comprehensive tools to fleet managers so they can understand and analyse vehicle operational utilisation with granularity and depth. Through a combination of filters, visual aids, and comparison tools, managers are able to derive actionable insights that will optimise their fleet operations.

The Operational Utilisation Report may be a major step in simplifying the process of extracting actionable information from fleet data but that doesn’t mean it’s lacking in analytical power. With a wide range of features to draw on, this reporting solution has the capability to support far-reaching operational improvement.

Emissions Profile Insights

By now, most organisations will be aware of the importance of addressing emissions and the reputational, financial, and (for government fleets) legislative pressures to do this. But if you are not an environmental scientist, how do you get reliable data without it becoming an unwelcome management burden?

This is the report to provide accurate analysis of fleet emissions through graphical interpretations of the data. Highlight which vehicles are your worst emitters, how different teams in your organisation rank in emissions, and measure progress towards your sustainability goals – all easily done.

After all, determining a fleet's environmental impact and gaining the emissions measurement to set and meet sustainability goals is practically impossible without detailed emissions tracking visualisation and a thorough analysis of individual vehicles and the fleet.

EV Fleet Insights

Managing a fleet of EVs poses a range of unique challenges for Fleet Managers. Keeping vehicles charged means that Fleet Managers need to be able to report on the current status of every EV in your fleet. While Smart chargers can do this while a vehicle is plugged in, it doesn’t provide a complete overview of every vehicle’s charge.

The EV Fleet Insights tab solves this issue by allows you to view the status of your entire fleet of electric vehicles. See what the current charge percentage is, the predicted available range, and whether the vehicle is plugged in and charging.

Powered by Nextrak, this Insights Report is the vital data that streamlines the day-to-day management of a fleet of EVs. Ensures your EV fleet never has a flat battery again.

Advanced Features

Heatmap

Represents usage data across the selected time period, with warmer colours indicating higher utilisation.

Date And Time Selection

Specify a particular time period to review and focus reports on your core business hours for a clearer view of everyday fleet activity.

Compare Toggle

Easily compare groups of assets or time periods to identify long-term trends or overall performance.

Vehicle Group Selection

View data of specific groups of vehicles so you can assess the operational utilisation of each group independently.

Graphic Smoothing

Identify the broader trends and patterns that may be obscured by daily variances. Can be set to daily, weekly, or monthly.

Drill Down on Individual Assets

Dissects the selected group(s) into its constituent parts to assess and identify individual vehicle performance.

Knowledge Base

Discover more about what our solutions can do to elevate your organisation's fleet and asset management practices.

EV Fleet Management Guide

Read more

The Benefits of EV Tracking

Read more
Read more articles

It's easy to get started with smartrak 

We're happy to answer any questions you have to help you find the right solution. fill out the form below and we'll be in contact shortly
crossmenucheckmark-circle