Driver-based reporting is an important and powerful tool to help Fleet Managers monitor how an organisation’s vehicles are being used. We understand that diving into reports and reams of data can be intimidating and overwhelming. Smartrak have put together this guide to help:
The first thing to understand about driver-based reporting is that it relies on two key pieces of information – GPS data and the ability to identify who was driving during an individual trip. GPS data is obtained through our telematics solution. It provides you the context of where your fleet vehicles are, have been, and how they’re being driven. It is this data that lays half of the foundation of driver-based reporting.
The other key piece of information you need is who was driving each fleet vehicle at a particular point in time. While you can keep paper records, or manage bookings in a spreadsheet, a more thorough way to track this is through our driver identification solution. This helps Fleet Managers pinpoint exactly who was behind the wheel and provides the other half of the foundation required for driver-based reporting.
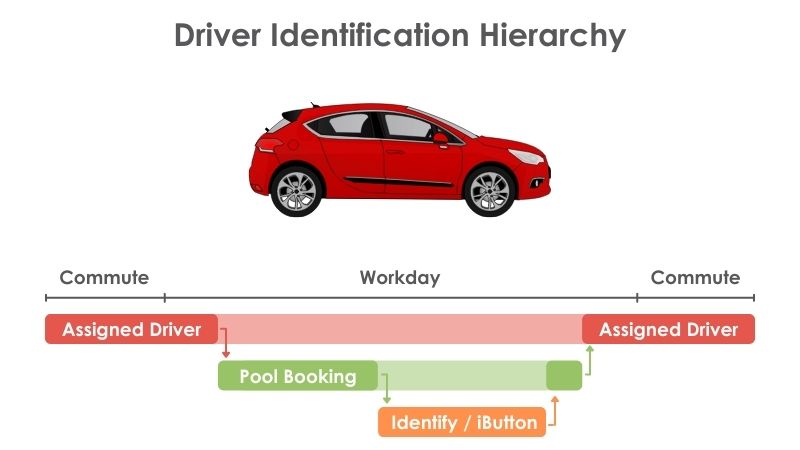
Smartrak has developed a suite of products that, when combined, make up our Driver Identification solution. We realise that no two organisations are alike, and the same goes with fleets. Rather than provide a single method of identifying drivers, we have a whole suite of solutions that can be used in combination with one another. This includes our iButton RFID tags, the Identify app, PoolCar, and Assigned Drivers. This best-in-class solution ensures organisations can tailor an identification approach based upon the needs of their fleet.
The beauty of this system is that each type of identification operates in a specific hierarchy, where higher sources of identification overrule lower priority sources. This means that the system can account for use cases where employees borrow vehicles that might have an assigned driver or share driving responsibilities on long trips. By having a robust driver identification system, you capture exactly who was driving and ensure that you can take advantage of our driver-based reports.
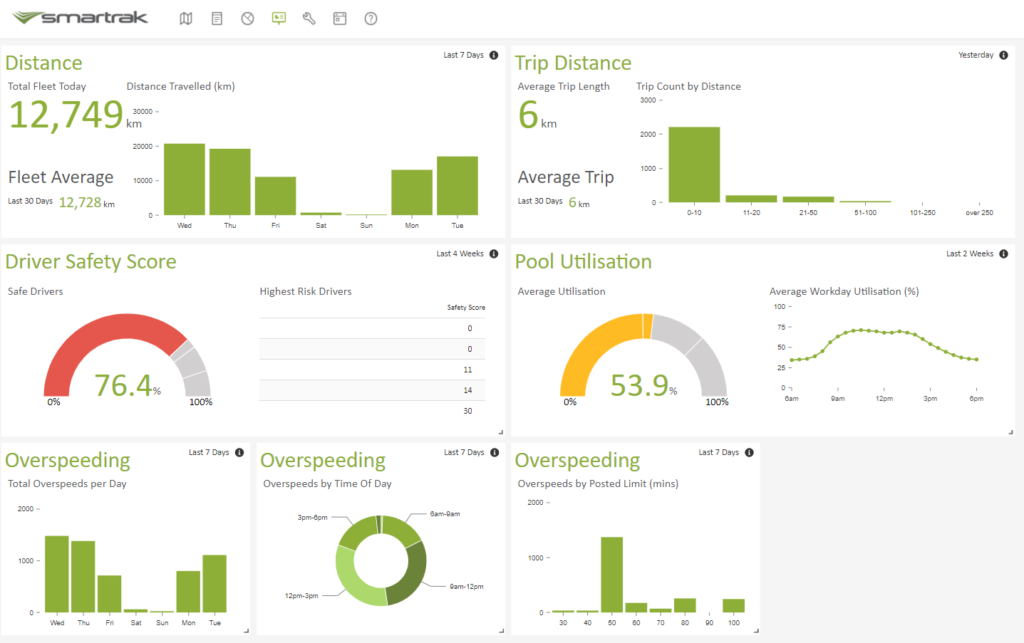
Before diving into driver-based reporting, your first stop should be the Smartrak Dashboard. The Dashboard provides a snapshot of how your fleet is being utilised. It also offers several data breakdowns to give you top-level insights on how your fleet is performing.
Because you’re already taking advantage of our Driver Identification solution, you should have access to the Driver Safety Score widget. This pulls data from several sources and is calculated using a complex formula to arrive at an actionable score. Your overall safety score is an aggregate of all your employees, with higher scores indicating a safer fleet.
The widget also highlights the highest risk drivers over the previous four-week period, which can provide a great starting point to dive into our driver-based reports.
We’ve got several reports that are specifically tailored for driver-based reporting:
By utilising these reports, you can start to uncover exactly who in your organisation is driving in a risky manner.
One of the biggest things to be mindful of when looking at report data is how meaningful a single data point is. Yes, it’s important to investigate why an employee was travelling 20+km/h over the speed limit. It’s also important to understand why harsh acceleration, breaking, and cornering events occurred. But while single events are often a red flag, they don’t tell the whole story. That’s why we recommend looking at driving trends.
By analysing longer time periods rather than individual events, you can build a better picture of employee’s driving behaviour. If you identify a repeating pattern or trend, then you’ve got much more solid evidence than just a single overspeed event. It gives you the ability to take proactive action.
By proactively actioning risky behaviour, you can help educate individuals before a serious accident, traffic infringement, or speeding fine. You can work with managers to take actionable steps and provide clear guidelines on what is expected when driving fleet vehicles. But most importantly, you can accurately track and measure an employee’s progress towards safer driving practices.