As a corporate member of Drive Electric, Smartrak looked forward to DE’s State of the Nation Report: E-Mobility in New Zealand 2023. With 2023 drawing to a close there was plenty to take stock of as interested organisations gathered at DE’s Auckland headquarters for the Report’s official launch.
A year of celebrations and concerns
During 2023, and earlier, the continuing growth in EV adoption and Smartrak’s own product development commitment to supporting EVs in fleets were part of an upward trajectory to be celebrated. Unfortunately, alongside these good-news stories there were also increasingly loud bells tolling for the planet, with a catalogue of temperature records broken through the year, alongside regular floods and fire storms.
Fortunately, the Report had lots of heartening stats on the progress that’s been made worldwide and in New Zealand to purge carbon from transport.
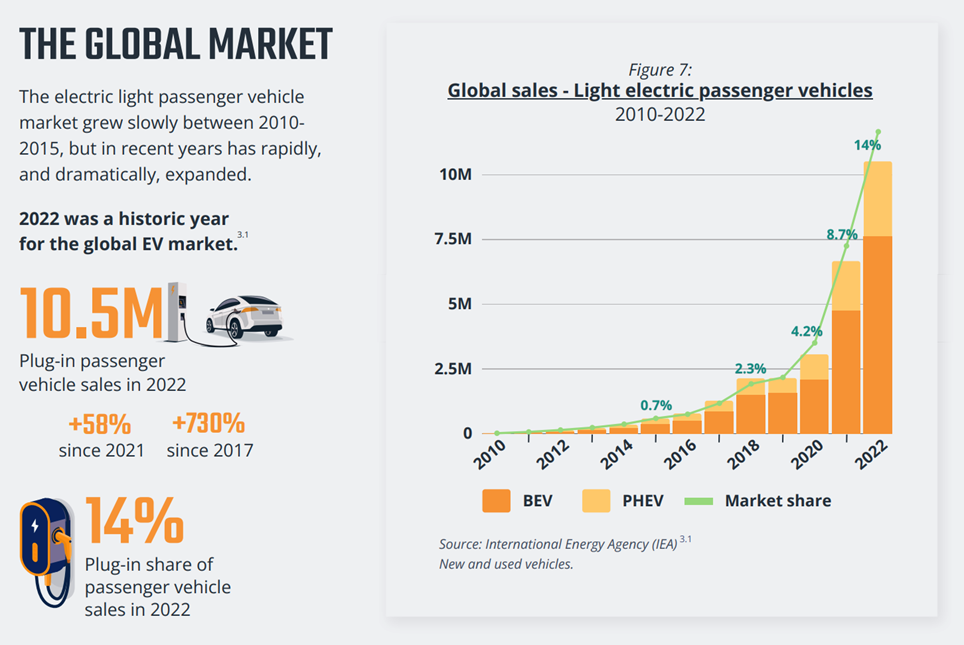
Global sales of EVs hit 10.5M and snagged 14% of the market in 2022
The EV model range grew 39% over 2 years
Average EV range has increased 101%
NZ’s EV fleet has grown 70% in just the past year.
NEW GOVERNMENT – NEW APPROACH
The 78-page download is packed with information, including chapters on micro-mobility, heavy transport, EV charging, maritime and aviation transport. There is also a section on New Zealand Policy which lays out considerations DE believes are important to lifting the percentage of EVs in the national fleet beyond 2%.
This section is undoubtedly laying the groundwork for discussions DE expects to be having with the new Government’s Minister for Transport, Simeon Brown. Before the election. DE listed ‘Certainty and Consistency Over The Long Term’ as an import point for consideration, and pointed out that the Climate Change Response (Zero Carbon) Act had been agreed with bipartisan support. However, it's obvious that previously held expectations will have to be adjusted.
For example, before the election, Christopher Luxton was candid in his opinion of the Clean Car Discount or ‘Ute Tax’, saying: “National does not believe New Zealanders who can afford a brand-new electric car need a subsidy from taxpayers to buy it. The move to EVs will happen without subsidies as those who can afford new cars choose to reduce their personal carbon footprints and their dependence on fossil fuels,” Luxton went on to say: “The subsidies funded by Labour’s Ute Tax don’t go to low- and middle-income New Zealanders, but to people who can already afford to buy an EV. And it is deeply unfair to tax work vehicles like utes and vans that farmers and tradies need to do their jobs in order to subsidise the cost of EVs.”
That’s a pretty clear opinion on the Clean Car Discount, and before the election, National brought some clarity to the Discount’s demise by stating the scheme will be scrapped by December 31, 2023, which the new government subsequently did.
DE will undoubtedly be viewing the end of the discount with disappointment and is continuing to advocate that an alternative incentive is explored, given the obvious benefits to the economy and the environment from electrification.
The end of the Clean Car Discount is to be lamented, however, from Smartrak’s point-of-view it’s any changes to the policies mandating lower emission fleets within the government sector that we will be focussed on. While government fleets are a small percentage of the national fleet, compared to commercial and private fleets, we believe they still offer valuable examples of positive change and are an important proving ground for emerging technologies and fleet management strategies.
We have witnessed a strong commitment from local and central government customers to lowering fleet emissions, which is great in the first instance, and likely a positive outcome for the national fleet in the long term. Most New Zealanders buy second-hand cars and more EVs passing through government fleets means more affordable EVs when these vehicles are retired. We have also seen how councils are leading by example; bringing EVs into their fleets and then expecting their outside contractors and suppliers to follow that example.
As the Report points out: “We are a small, right-hand drive market, with a high rate of vehicle ownership and a relatively old fleet. A high-emission vehicle entering New Zealand today will continue to impact our fleet for nearly two decades.” Short-circuiting that long-term problem by using government fleets as an incubator for private EV ownership should be seen by the government as a good move.
Elsewhere, the Report looks forward to a lower-emissions transport sector that reduces its reliance on cars for transporting people across short distances, with electric micro-mobility, ride-sharing, and mobility-as-a-service models posited, along with a lower-emission, more efficient public transport system. Investment in public transport is absolutely a factor that will be coming under intense scrutiny with the new government, which has already signaled that projects such as Auckland’s light rail, Let’s get Wellington Moving, and numerous cycle lane projects will not be going ahead.
Successful advocacy here will no doubt depend on receptive people in councils, although the price tags for meaningful change may limit aspirations to more bus lanes and perhaps more electric buses.
We read the section on Heavy Electric Vehicles with a thought to the efforts of Jump Charging as they work towards building charging networks that will be suitable for big trucks to use (driving through rather than pulling into a bay that’s too short for them). We hope that Alex Watson at JC will be adding his name to the list of people waiting to talk to Minister Simeon Brown. National’s plan to roll out 10,000 chargers by 2030 could also include a truck-friendly design element that lifts our electric truck fleet above the 141 currently on the road.
A Report topic that Smartrak has also been diving into concerns the challenges faced by electricity networks as they upscale to meet EV demand. Our talks with a range of EV charging infrastructure providers highlights the vital role smart chargers will play in moderating demand and avoiding costly infrastructure upgrades for both the networks and their customers. We’ve brought the insights together in a webinar that we are hoping to release shortly. From the Report, it was interesting to read that 82% of EV charging in NZ is done at home while 76% of EV drivers say they have used public chargers. Are they topping up when they are out and about because anything below 100% in the battery leaves them anxious or are they confident in their EV’s battery capabilities and journeying beyond home range? More research will tell.
In conclusion, this is a report that’s well worth a read, whether you’re an EV driver, fleet manager, or policy maker. You can download a copy here.
There are numerous obstacles on the road to fleet electrification. Keeping vehicles charged means that Fleet Managers need to be able to report on the current status of every EV in your fleet. While Smart chargers can do this while a vehicle is plugged in, it doesn’t provide a complete overview of every vehicle’s charge.
Then there is the impression that an EV isn’t going to work as hard as its petrol or diesel counterpart. We often hear customers say they don’t want an underperforming asset, especially when referring to perceived range and battery limitations.
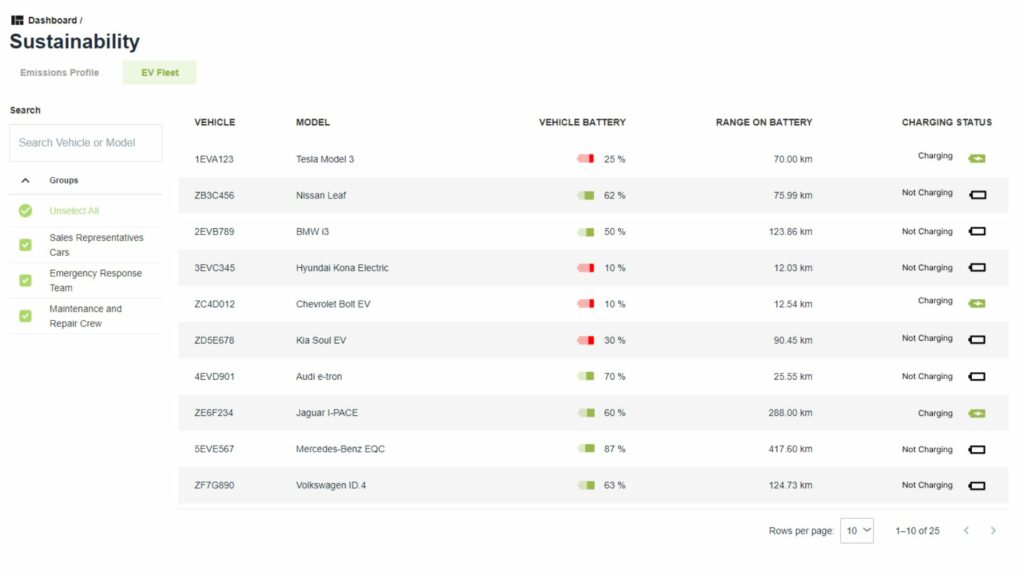
Introducing EV Fleet Insights
The EV Fleet Insights tab is the next release of our Insights Reports. Powered by Nextrak, it allows you to view the real-time status of your entire EV fleet in a single graphical report. In an instant, understand each vehicle’s current charge , its predicted available range, and whether the vehicle is plugged in and charging.
Powered by Nextrak, this Insights Report is the missing link that streamlines the day-to-day management of a fleet of EVs. This is a step-up from simply relying on the data provided by smart chargers, as you’ll know the status of every vehicle in your fleet, regardless if they’re plugged or not.
Now you’ll be able to accurately prioritise vehicle charging. Instead of guessing which vehicle should be charged next or relying on inflexible charging schedules, the EV Fleet Insights Report will show you exactly which vehicle should be charged next. See which This is critical when managing a large fleet of EVs and often a handful of chargers.
The report gives you the flexibility to search for a specific vehicle by make or model, or alternatively drill down on a specific group of vehicles thanks to the report’s list filter.
The EV Fleet Insights report is available now to all Smartrak customers with Nextrak installed.
Are you ready to start gaining Insights into your EV Fleet? Get in touch below to schedule a Nextrak demo today.
Uncovering insights about how your fleet is performing is one of the hardest tasks a Fleet Manager has. Without the use of asset tracking, you have no way to track your fleet’s daily, weekly, monthly, and annual usage. Without effective reporting tools, diving into the data and picking apart how your fleet is truly performing is a challenge. While Smartrak has a wide range of reports that Fleet Managers rely on day in and day out, we realise there is often a need to streamline the process of fleet reporting.
That’s where our new Insights Reports come in.
Introducing Insights
Insights Reports have been specifically developed for Fleet Managers to monitor and optimise the efficiency of their fleets. They offer an alternative to crunching data in spreadsheets via a streamlined and interactive experience that makes analysing fleet data a breeze.
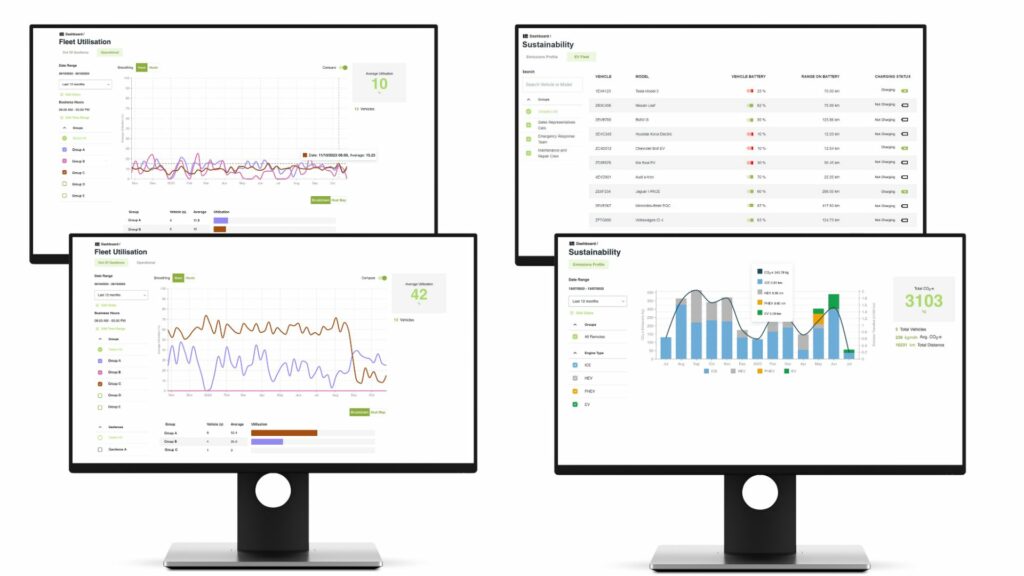
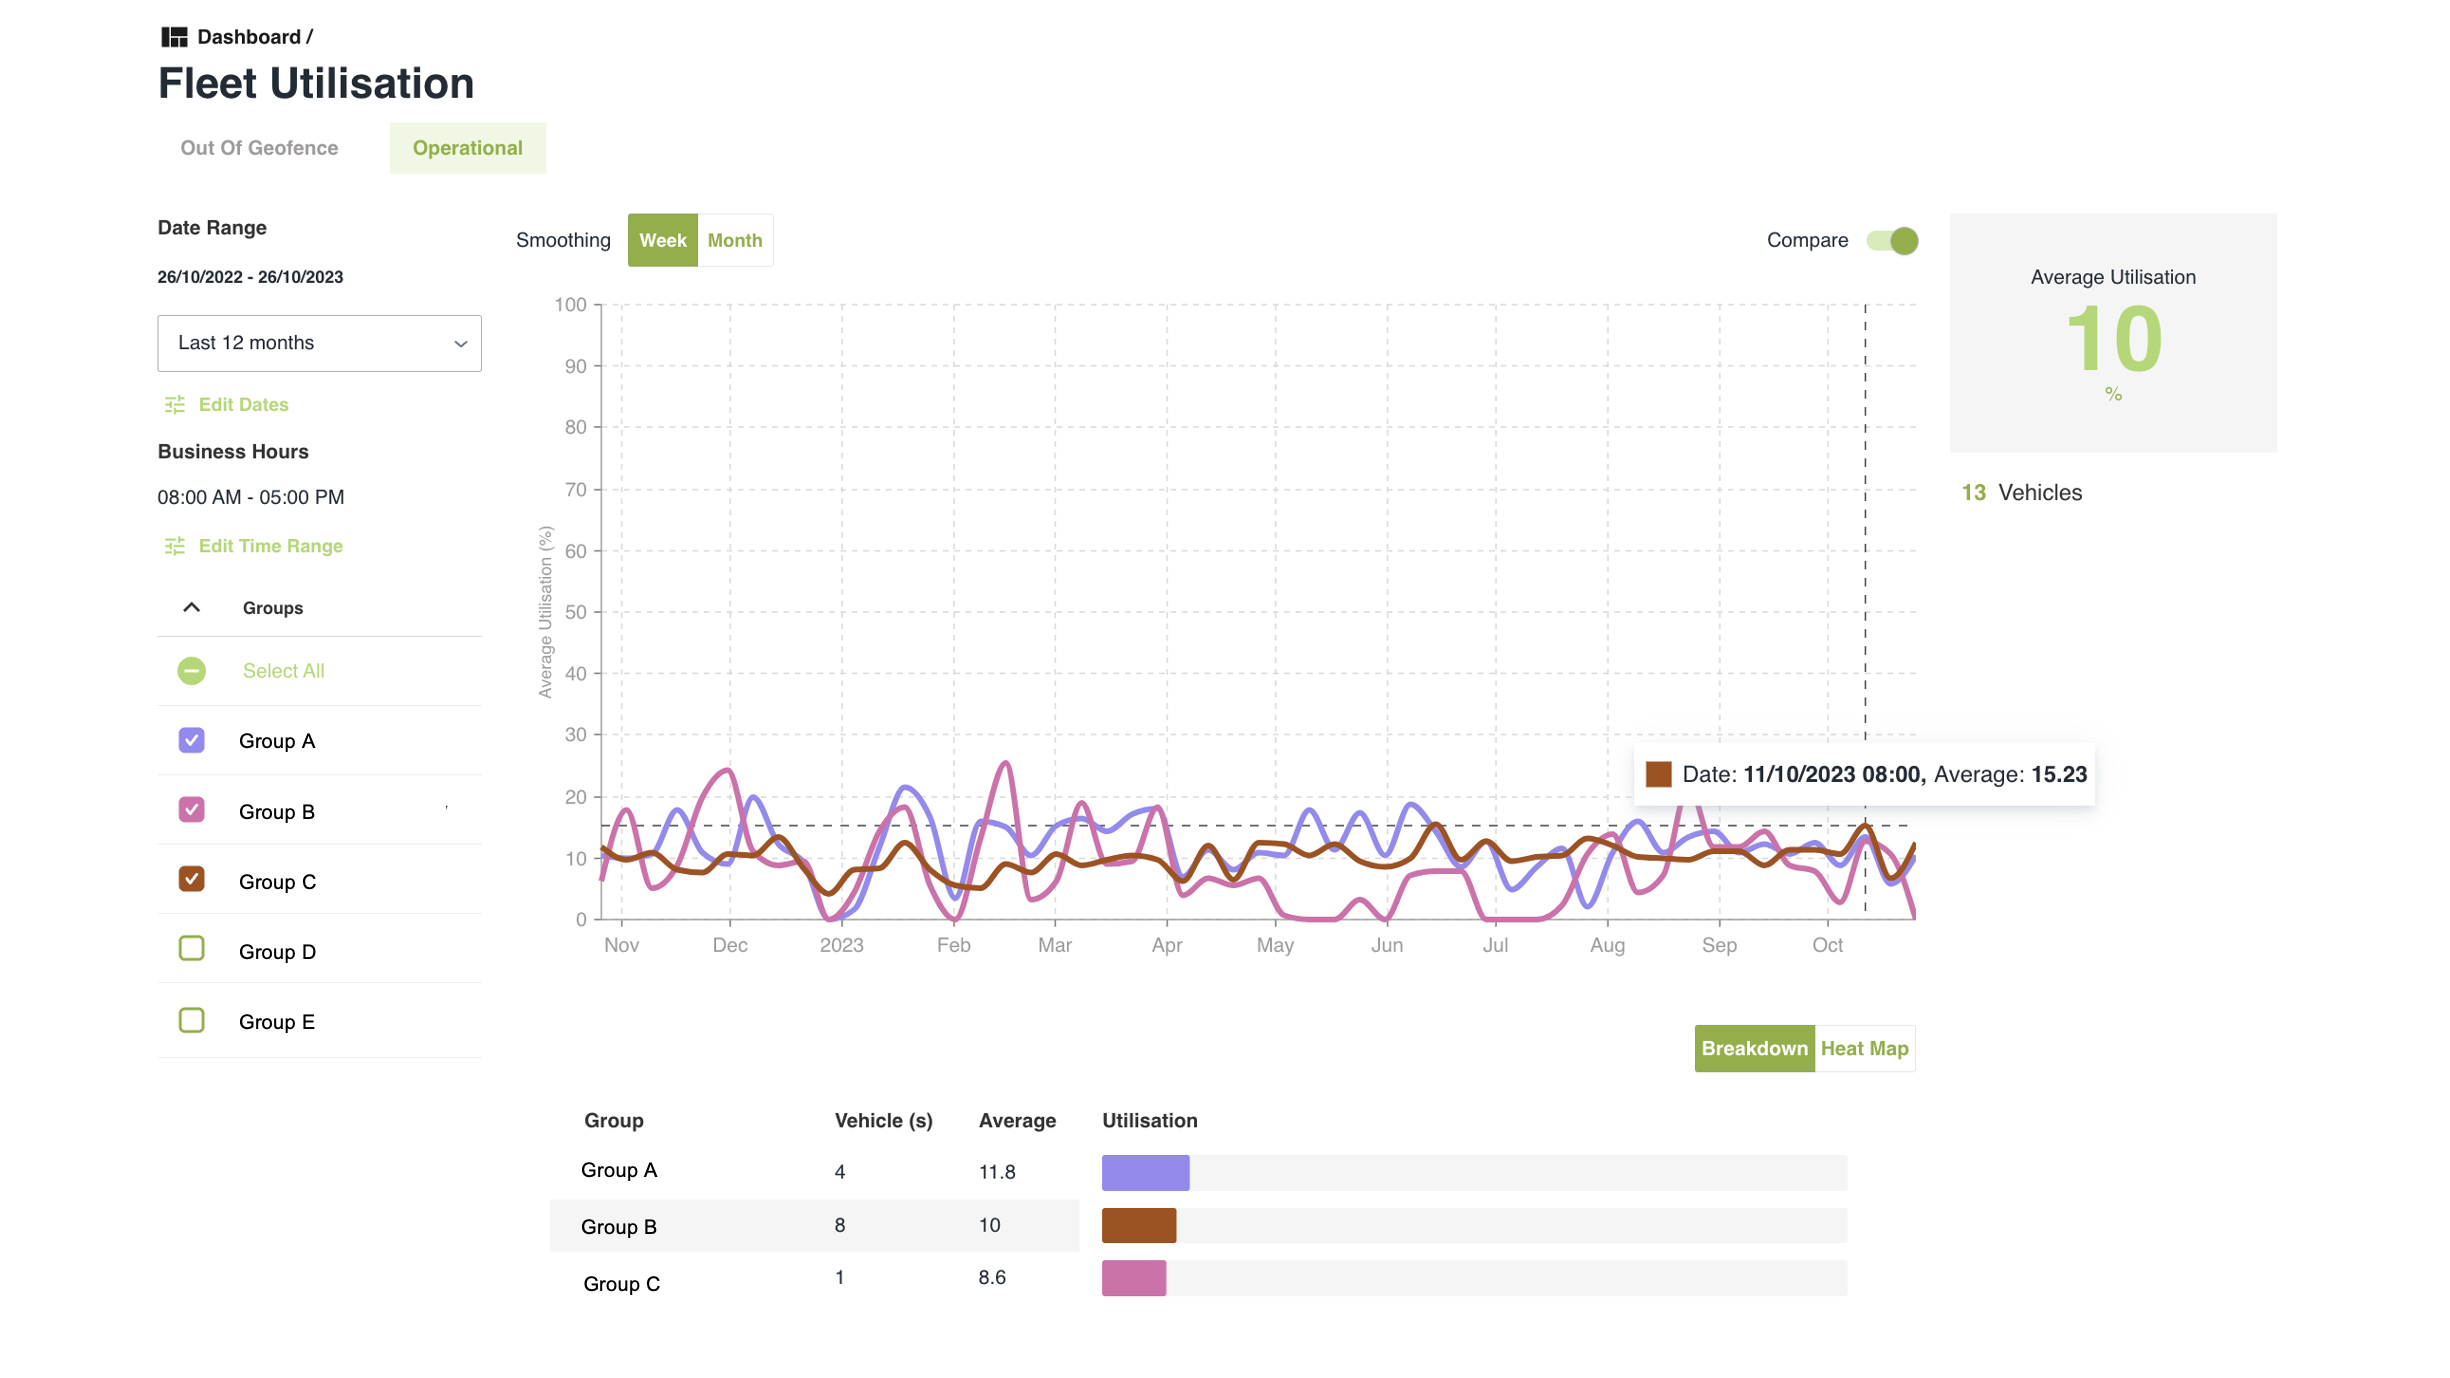
Currently there are four insights reports available, and two dedicated to analysing fleet utilisation: Out of Geofence Utilisation and Operational Utilisation. The two utilisation reports complement each other and deliver exceptional visibility over fleet operations.
Out of Geofence Utilisation overview
Out of Geofence Utilisation is the first Insight report that Fleet Managers will want to check. The report leverages the geofence capabilities baked into the Smartrak map and measures the time that vehicles and assets spend outside of their ‘home’ geofence. This Insight Report provides a great first step in understanding how your fleet is being used on a daily, weekly, or monthly basis.
Operational Utilisation Overview
Operational Utilisation is the next step that Fleet Managers should take when undertaking a detailed analysis of their fleet’s utilisation. Unlike Out of Geofence Utilisation, Operational Utilisation is based on the time a vehicle’s engine is in operation: highlighting when a vehicle is actually in use, rather than parked up.
Insights Overview
Before we dive into how to leverage the new Insights Utilisation Reports, we thought it would be worth doing an overview of the various reporting features and how you can use these to gain the insights that are important to your operations.
Date ranges and business hours
We support a lot of 24/7 organisations such as Hospitals and Emergency Services. However, most businesses only need to analyse a set of core business hours. The date range and business hours function gives users the ability to narrow the data view in order to focus on only the time ranges that are relevant.
Groups
Assets in Smartrak are often grouped together for reporting purposes. This could be due to vehicles being based at a specific location or ‘home’ geofence. This feature provides the ability to filter only the groups that you want to focus on. Unchecking certain groups will remove them from the report although they can be added back at any time.
Utilisation Graph
Where the magic happens. This graph will display fleet, group, or vehicle utilisation based on the parameters and filters chosen. The figure to the right shows the overall utilisation as a percentage across the selected timeframe.
Group Breakdown
Do you need to know more about the makeup of a specific group? Select the required group to break it down into its constituent parts.
Heat Map
A secondary visual representation of utilisation that graphically illustrates tends. Darker colours represent higher utilisation, while lighter colours represent lower utilisation.
Compare Groups / Vehicles
Flicking this toggle will allow you to compare the aspect of the fleet you are focussed on against a different date range or time period, group or vehicle.
Smoothing
This option gives you the ability to smooth out individual data points. This is especially useful for longer time periods, where separate data points will appear as noise, making analysis difficult.
How to dive into the data and make sense of your fleet’s utilisation
Let’s work through an actual scenario so you can see the power of these reports in action.
Say you’re a Fleet Manager who’s been tasked with reporting on vehicle utilisation and you want to tell a compelling story about how the fleet is being used. This will entail not only data but the insights that illustrate how the fleet is actually performing.
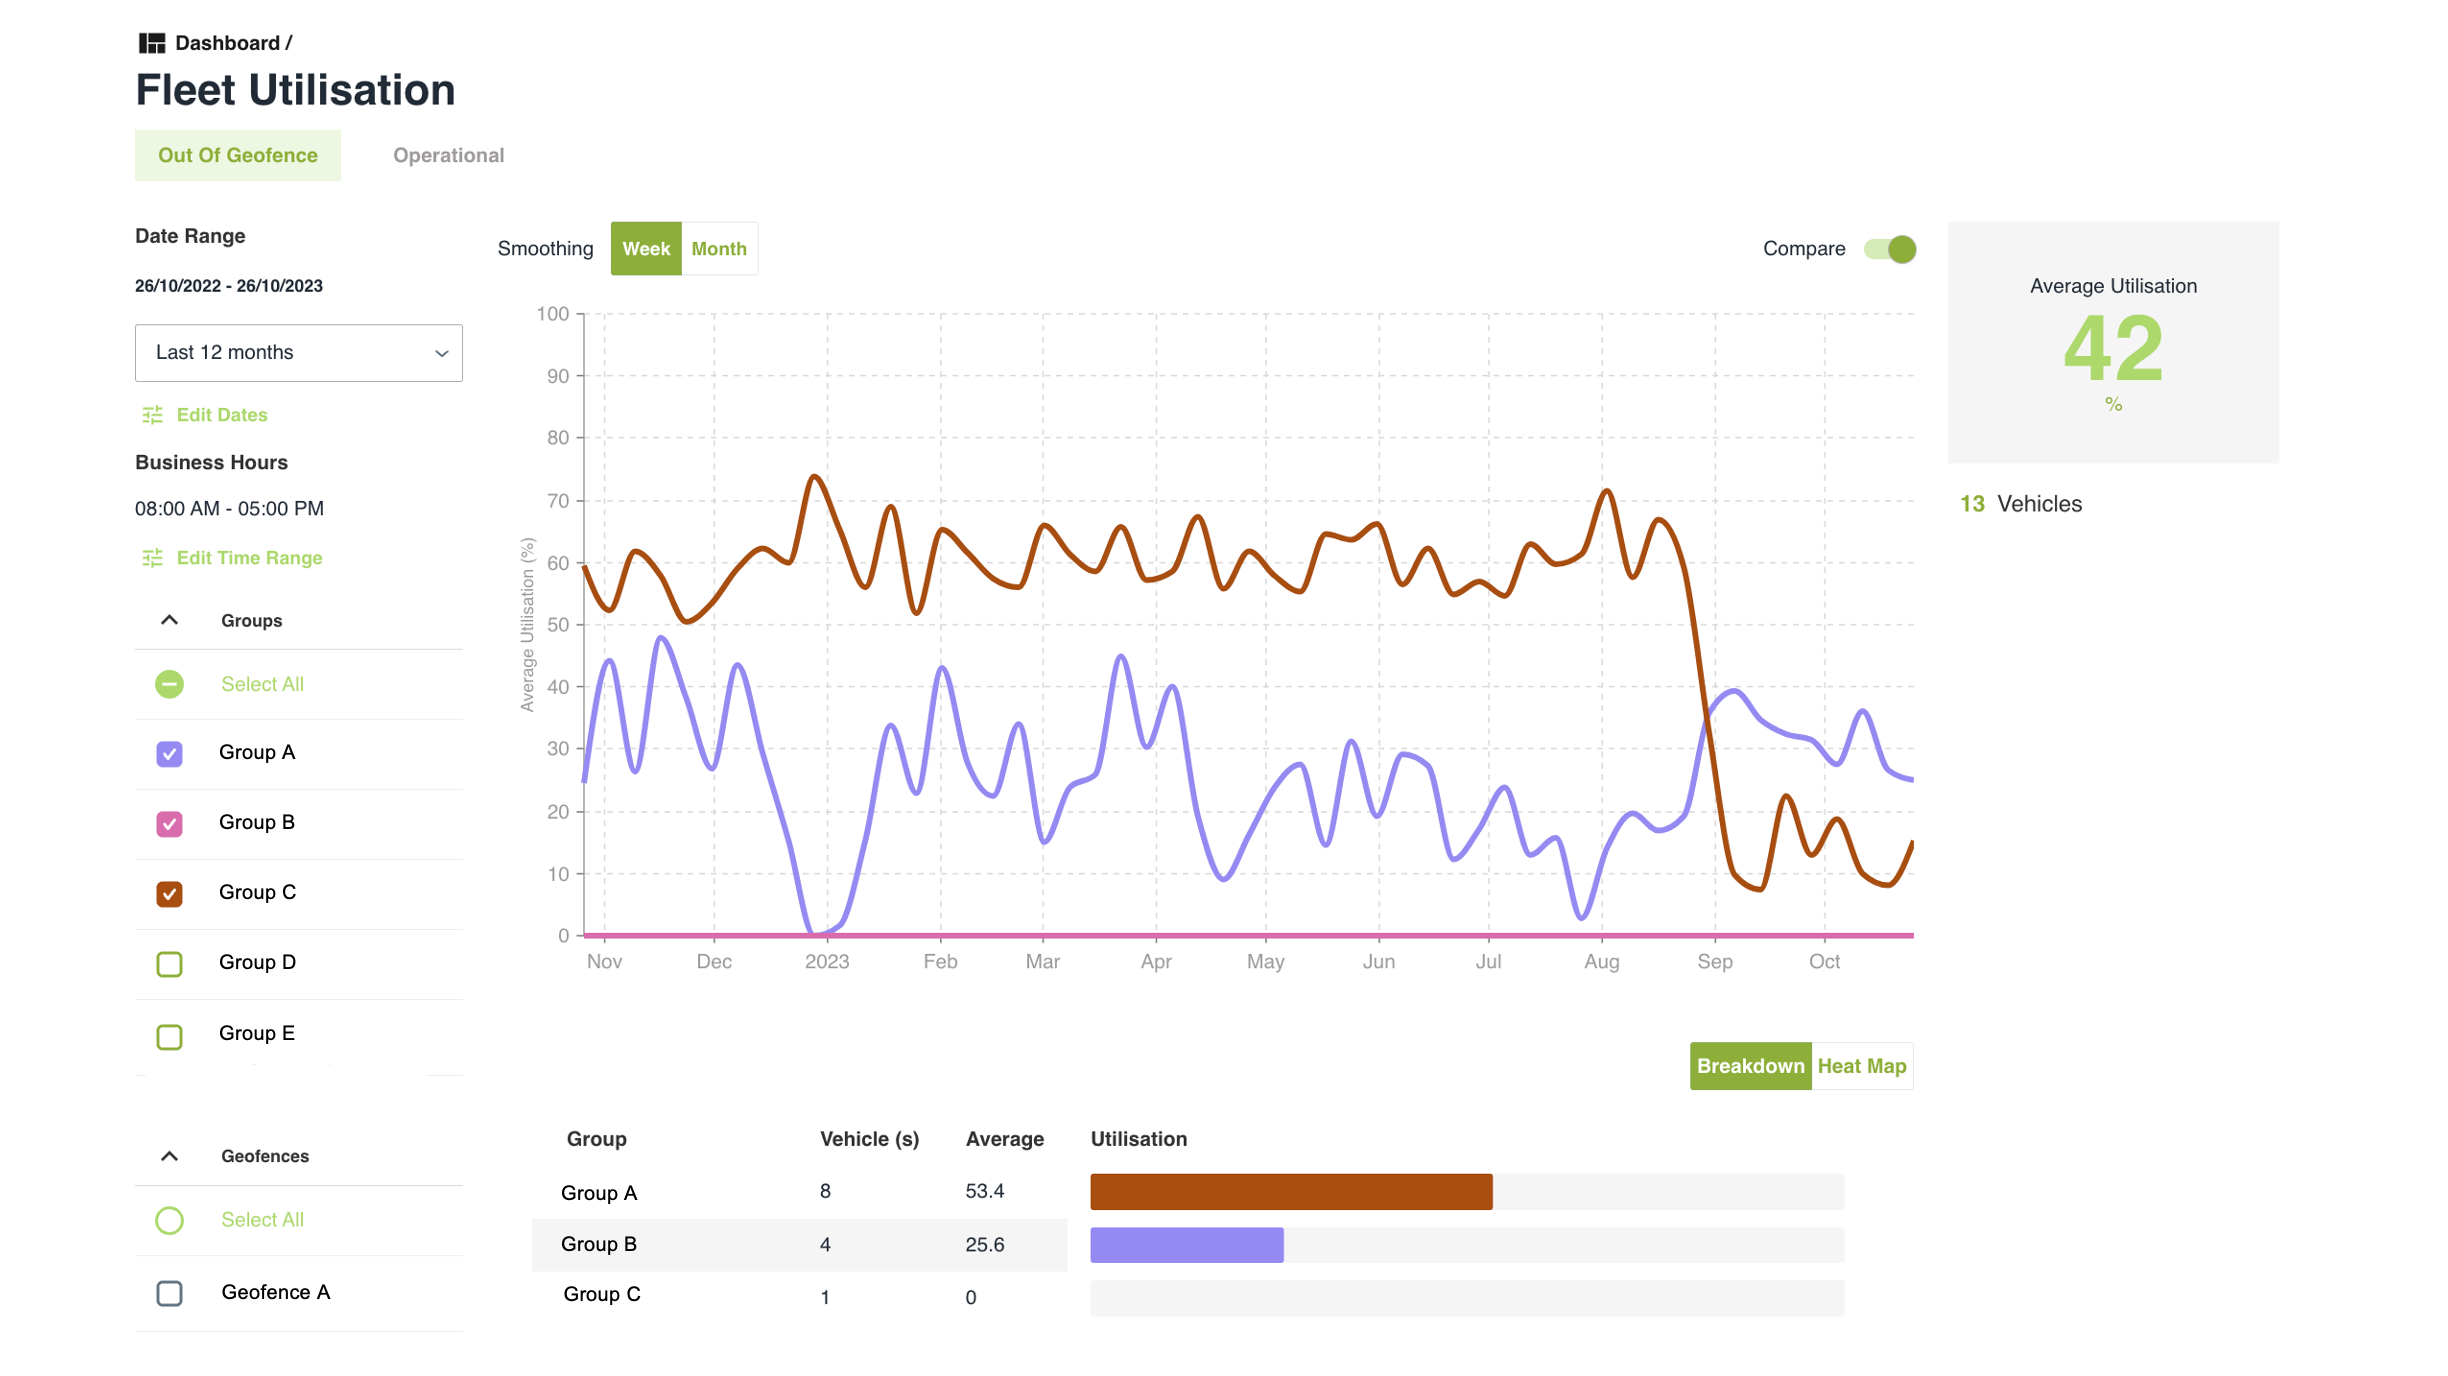
The first port of call would be to run the Out of Geofence Insight Report and set the date range for a suitable time period. In the example image, we’ve chosen a twelve-month period.
You have decided to drill down into a couple of groups, each with a different number of vehicles. You have also filtered your organisation’s business hours (8am to 5pm) and selected weekly smoothing so you can still see fluctuations in the utilisation. Once the report has refreshed, you see straight away that your average utilisation is sitting at 42%. Great work.
There are, however, a couple of areas of concern. Group A’s utilisation has dropped significantly in the last two months. It was fluctuating between 55% and 65% but has plummeted to between 10% and 20%. What happened in September to impact fleet usage?
Group B has hovered around an average of 20% - 40% for the whole 12-month period. There are four vehicles, so there could be an opportunity to shift one vehicle somewhere else and improve overall utilisation rates. But this depends on how the vehicles are being used; more information is required (the Operational Utilisation Report will be just the place to find it).
Furthermore, Group C has registered 0% utilisation across the entire year. While It’s only a single vehicle, if no one’s using it, there may be other areas of the business that could take advantage of that asset, or is this an opportunity to de-fleet the vehicle and lower the fleet’s overall operating costs? Afterall, fuel, maintenance, registration, and insurance are significant and unnecessary overheads for an asset that hasn’t been touched in 12 months.
This is all good information, but it’s not the end of the story.
Next, it’s worth diving into the Operational Utilisation Report, for more granular detail as this report monitors actual vehicle running time. You’ll soon see that this measure of vehicle activity provides a different perspective.
In the Operational Utilisation Report the average operational utilisation is only 10%. What’s going on?
Group A still has the highest utilisation, but not by much. What you’re discovering here is that Group A vehicles are exiting the geofence but not being driven for the majority of the time they are outside the geofence. This is causing the fleet’s overall utilisation rate to fall. Is this insight highlighting an opportunity better use vehicles; perhaps a single vehicle transporting two teams to different tasks could be the solution?
Surprisingly, Group C is edging close to 10% utilisation. How can that be? Because the vehicle hasn’t triggered a geofence exit / entry event, the only answer is that the vehicle is being used exclusively inside it’s home geofence. If the home geofence encompasses a large campus, 10% utilisation could denote a vehicle that’s used for transporting people or materials from one department to another. Further investigation may show that three or four e-Bikes would be a more appropriate solution – saving operational costs and reducing emissions.
Heatmaps for further analysis
Both reports also show a heatmap of when each vehicle or group of vehicles is in use. This can be used to quickly identify utilisation bottlenecks and periods of peak activity.
Hint: don’t aim for 100%
Utilisation is never going to be 100% for any fleet and for vehicles with specific tasks such as breakdown recovery utilisation rates could be very low. Our recommendation is that Operational Utilisation rates in single digits generally highlight a need to dig deeper. This could involve assessing operations, the fleet’s size and possibly its make up.
How to take your analysis to the next level
Sustainable Transportation
Understanding Operational Utilisation based on driving time directly correlates to environmental impact. By optimising each vehicle's driving time, fleet managers can reduce the fleet's overall carbon footprint, contributing to greener and more sustainable transportation solutions (and cost savings). When a fleet is operating efficiently it’s burning less fuel and reducing emissions.
While optimised operations will support your move to a more sustainable fleet, it’s adopting EVs that will deliver the big gains. Often, a fleet will bring in the number of EVs it feels can be accommodated within existing operations. This number will depend on a range of factors including range requirements and the investment required for charging infrastructure. By investigating both the Geofence and Operational Utilisation reports Fleet Managers can gain the insights to make EV adoption decisions based on actual data. Knowing when vehicles are within the home geofence highlights opportunities to plug EVs into chargers, to extend the utilisation window. These insights can also inform your charger infrastructure strategy, to avoid over-investment in chargers.
Data-driven Decision Making
The graphical reporting insights from driving time enable managers to make informed decisions related to fleet management, such as optimal scheduling and targeted maintenance based on actual usage. This ensures resources are utilised efficiently and minimises wasteful practices.
Decision making based on Insights Reports will also reduce the time it takes to progress new ideas. These reports are designed for sharing so various departments can be brought up to speed on what’s happening in the fleet and armed with the knowledge to contribute to effective decision making. The data is also presented in a way that will greatly improve the value and clarity of project overviews and business cases, without adding extra workload.
Performance Analysis & Future Strategy
Fleet managers commonly state that there isn’t enough time for them to devote to strategy planning. This is where Insights Reports can be a significant help. The portfolio of functions that you can bring to the analysis of a wide range of fleet activities enables quick reviews and comparisons to aid analysis without resorting to different reports and trying to compare your results. This functionality can be your weekly or monthly management toolkit, allowing you to refine operations for best result or to plan for the advances you can see in fleet efficiency.
Start using Insights Reports and quickly discover that it’s essential for ensuring the fleet aligns with business needs and is positioned for delivering high standards of service. Plus, you’re using a reporting platform that’s designed to support future thinking. Smartrak’s development pathway for Insights Reports includes more ways to look at utilisation, new reports on driver behaviours, and an expanding platform of fleet sustainability tools that will be pivotal for shaping your future-fleet strategies.
Smartrak is excited to announce a groundbreaking EV Enablement Initiative that will see the development of industry-leading software, for the frictionless operation and management of electric vehicles.
Collaborating with a handful of forward-thinking organisations, Smartrak will form a Special Interest Group (SIG). This includes Griffith University, a sustainability leader committed to the environment and social justice, and Aurecon, an international design, engineering and advisory company.
“This Initiative is a unique opportunity for us to work closely with these customers to shape the development of EV enablement software,” says Dr Sharlene Smith, Smartrak’s Business Manager - Sustainability Initiatives. “The innovative co-development process will ensure that we’re developing the solutions that will advance the adoption of EVs within fleets.”
The Initiative will focus on several areas that are critical to successful EV adoption and maximised EV utilisation. These include EV charge management and prioritisation, reporting and insights, and emissions management. There will also be a focus on end-user functionality that facilitates and streamlines the integration of EVs into fleets.
“Aurecon are thrilled to work alongside Smartrak in our journey to decarbonise our vehicle fleet, says Rich Mitchell, Aurecon’s Intelligent Transport Systems ANZ lead.
“As Griffith University has progressed its fleet to electric vehicles, it was crucial to us to also have fleet management and booking systems that not only effectively facilitated the operations of the EV fleet but encouraged and supported its users in adapting to using electric vehicles,” says Mitchel Howard (Acting) Manager, Parking, Traffic & Logistics.
“This was the driving force behind partnering with Smartrak and engaging in their Sustainable Transport Initiative,” says Mitchel Howard. “They are leagues ahead of the market in not only EV fleet management but engaging with customers like us to adapt their system to our needs and priorities. The Sustainable Transport Initiative has allowed Griffith University to vocalise our priorities such as emissions reporting, reporting on FBT savings due to increased EV use and customising Smartrak’s new Trip Planner to focus on intercampus travel.”
“The momentum of EV adoption in fleets is only going to build,” Dr Smith says. “We also recognise that EVs present a number of new challenges that currently constrain adoption. We see this Initiative as a way to develop the software that makes managing EV fleets as simple and straightforward as any ICE fleet. Our Initiative partners will provide the unique insights into how we achieve that.”
An industry-led approach
The key element that sets this Initiative apart from normal product development is the leading role that our industry partners will play in setting goals and assessing outcomes. As members of the SIG, participants actively contribute to and guide the functionality, user experience, and capabilities of the final solution. In doing this, they share experiences and insights within the group to foster a truly collaborative process.
“The primary objective of the Initiative is to create products and features that address the true needs and expectations of the market,” says Peter Grant, Smartrak’s Chief Executive Officer. “We want to remove friction from a fleet’s transition to electric vehicles.”
There’s still time to join the Initiative
The intention is to limit the membership of the SIG to a small group of organisations with a shared commitment to EV integration. To this end, Smartrak is inviting organisations (you don’t have to be a Smartrak customer) to join the SIG and participate in a unique opportunity to co-design the tools that will accelerate the transition to EVs.
About Smartrak
Smartrak proudly leads the charge as the foremost provider of advanced EV fleet management and Sustainable Transportation solutions. Dedicated to facilitating EV enablement, addressing administration, and streamlining shared fleet management throughout Australia and New Zealand. Our expertise positions us as the preferred choice for government agencies, councils, healthcare, and utilities organisations, assisting them in their transition to Net Zero by enhancing fleet visibility, optimising utilisation, right-sizing their fleets, and effectively managing their electrified vehicles.
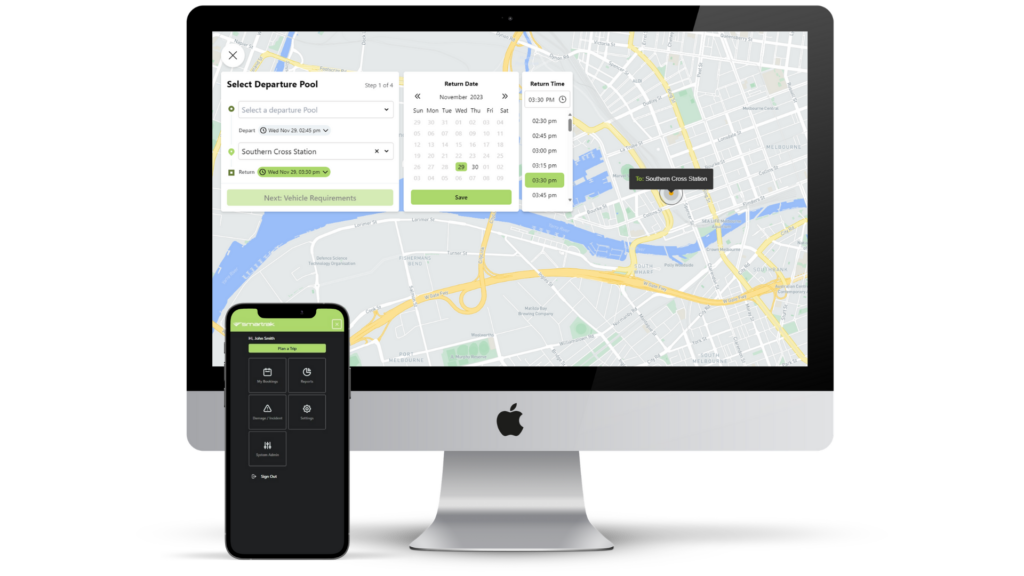
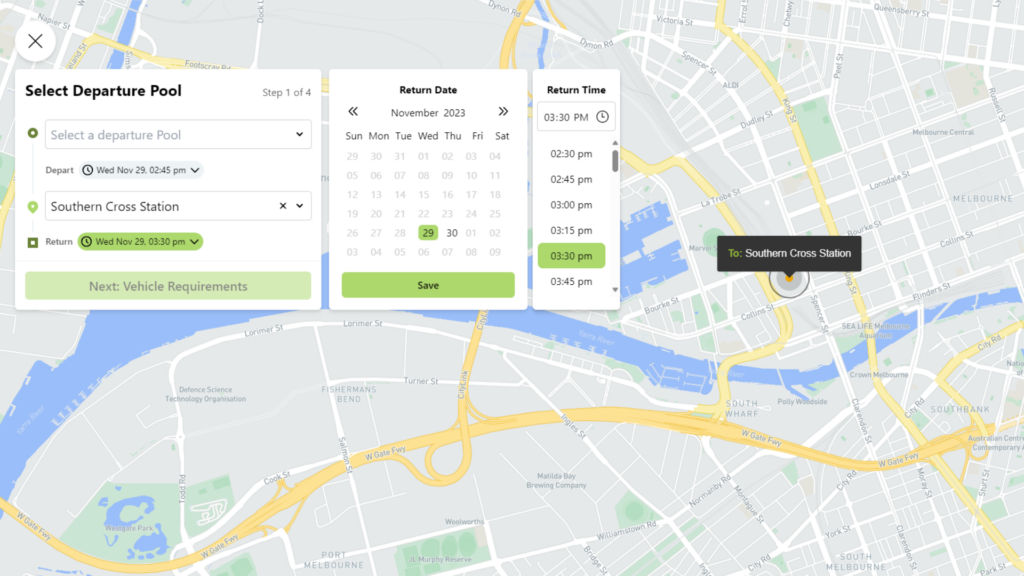
We're excited to announce that Trip Planning is now live for PoolCar customers.
With Trip Planning, Smartrak’s PoolCar customers can now take advantage of a modern shared fleet booking experience that sets the stage for sustainable fleet management.
As the focus for Smartrak’s ongoing shared-fleet innovations, Trip Planning benefits from a product development pathway that’s keeping our PoolCar vehicle booking solution at the forefront of UX/UI design, reporting, and emissions reduction.
Trip Planning offers more intuitive and simplified booking processes that aligns with modern UX and UI sensibilities.
A modern approach to pool booking
Trip Planning's improved user experience is simple to use, laying the groundwork to ensure that users adhere to your organisation's fleet goals. Rather than choosing a vehicle based on personal preference, Trip Planning prompts users to choose from a selection of available vehicles that best align with user requirements and your organisation’s chosen fleet strategy.
And if you have EVs equipped with Nextrak, Trip Planning eliminates end-user range anxiety by displaying each EV's current charge and predicted range.
Trip Planning features
The new Trip Planning booking experience offers the following features:
Modern Booking Interface – Users can enter their departure location (a pool) and destination on a map, providing a visual and intuitive approach to vehicle booking.
Date and Time Selection – Allows users to specify their departure and return dates and times, facilitating precise scheduling of vehicle usage.
Search Filters – Users have the option to apply various filters to narrow down their search results, making the selection process more efficient.
Mandatory Field Selection – This ensures users must fill in all mandatory fields, ensuring all necessary information is captured at the time of booking.
Battery Range Data – For vehicles equipped with Nextrak, the display will show battery range data, which includes the current charge level and the vehicle's maximum range.
Cost Centre and Project Code – Users can select a cost centre and project code if applicable, aiding in tracking and management of expenses related to vehicle use.
Personal Purpose Trip Option – There is an option to indicate if the trip is for personal purposes, offering flexibility in vehicle usage.
IPWEA Australasia is very pleased to announce Smartrak has signed on as the Institute of Public Works Engineering Australia’s (IPWEA) Fleet Sustainability Partner.
IPWEA Fleet is one of the key Communities of Practice that focuses on the activities undertaken to support an organisation’s objectives through the optimal and sustainable life-cycle management of its plant and vehicle assets. Key focus areas include fleet strategy, operations, safety, efficiency, maintenance, regulatory compliance, and the environment.
Smartrak is a leader in Sustainable Transportation solutions in Australasia. Offering telematics and booking software that provides deep insights into organisational fleets, Smartrak has enabled their customers to streamline their EV transitions and reduce their emissions profiles.
"Our partnership with Smartrak is an exciting step forward, marked by our shared goals and values in advancing support for fleet practitioners across the country, and internationally,” says IPWEA Fleet Director Marc Sibbald. “We are devoted to the development of capacity and capability within the market and are excited to support our members in keeping pace with the emerging technology landscape. We’re eager to connect industry with practitioners, fostering engagement and supporting education and growth within the market.”
Founded in 2006, Smartrak has grown to become one of the largest fleet management software providers in Australasia, with offices across Australia and New Zealand, helping hundreds of fleets gain visibility and insights into their operations.
“Smartrak is proud to be at the forefront of innovative solutions that enable organisations to realise the environmental, economic, and brand benefits of adopting sustainable transportation,” says Peter Grant, Smartrak’s Chief Executive Officer. “By surfacing real-time EV data, we provide insights that remove the friction from the transition.”
The newly formed partnership will also see the introduction of the Smartrak Fleet Certificate Scholarship that will provide two up-and-coming fleet leaders access to the IPWEA Fleet Certificate, as well as access to valuable resources to raise their capabilities in Fleet Management.
“Learning and education are at the core of Smartrak’s values, so we’re excited to support the next generation of fleet specialists as we transition to a more sustainable future,” says Mr. Grant. “The scholarship recipients will be offered a unique, and indispensable opportunity to learn as part of the IPWEA Fleet Certificate cohort.”
As well as the Scholarship for the Fleet Management Certificate, the Fleet Sustainability partnership will see Smartrak providing thought leadership on EVs and sustainability throughout the year, involvement at the 2024 IPWEA Australasian Fleet Conference held in March and regular contributions across the 2024 Fleet Training Days.
About IPWEA
The Institute of Public Works Engineering Australasia is the peak association for municipal and public works professionals in Australia and New Zealand. IPWEA is a global leader in the delivery of sustainable infrastructure asset management, financial planning and reporting.
About Smartrak
Smartrak proudly leads the charge as the foremost provider of advanced EV fleet management and Sustainable Transportation solutions. Dedicated to facilitating EV enablement, addressing administration, and streamlining shared fleet management throughout Australia and New Zealand. Our expertise positions us as the preferred choice for government agencies, councils, healthcare, and utilities organisations, assisting them in their transition to Net Zero by enhancing fleet visibility, optimising utilisation, right-sizing their fleets, and effectively managing their electrified vehicles.
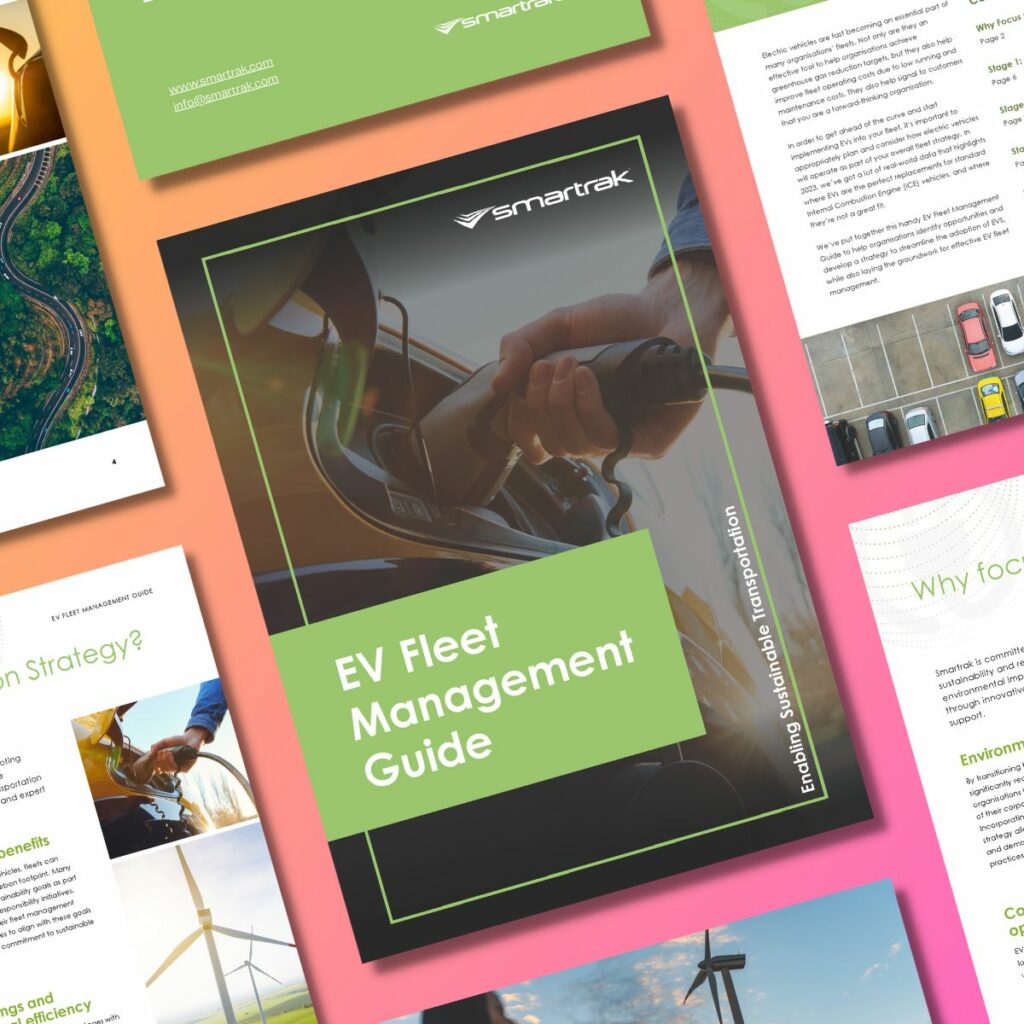
EVs are fast becoming an important feature of modern fleets. Especially when tackling reducing fleet emissions and operating costs. Thanks to the increasing range of EVs available and favourable government incentives, EV adoption rates have seen significant growth on both sides of the Tasman. The support ecosystem around EVs has also expanded with new charging providers and management solutions being released to the market with increasing momentum.
In fact, there’s been so much to consider, that Fleet Managers could be wondering how they sort through the growing roster of opportunities and challenges to make the best decisions.
Smartrak has been at the forefront of the EV wave. We’ve brought together the key lessons that will answer the questions you have about a range of EV topics. Our EV Fleet Management Guide is the how-to manual for successful EV adoption and essential reading for all Fleet Managers.
The Smartrak EV Fleet Management Guide covers the three areas that are critical to a successful EV transition:
Planning
Draw on the experiences of successful EV deployments to avoid the pitfalls and streamline the adoption process, from identifying the easy wins to bringing everyone along for the journey towards sustainable transportation.
Topics include assessing fleet composition, setting goals, and evaluating charging requirements.
Implementation
Understand the technologies that will make adopting and managing your EVs easier. Engaging with these solutions early will deliver the insights to support your EV management capabilities and inform your decision-making.
Topics include the benefits of a test deployment and refining your charging strategy.
Management
Learn how to gain visibility of key battery data and use it to maximise the utilisation of your EVs and support your EV charging investment. Topics include EV administration, tracking devices for EVs, and trip planning to build on your EV utilisation.
Extend your EV management capabilities with the essential EV resource for all Fleet Managers
The Smartrak EV Fleet Management Guide is packed with handy downloads and links to expand on your EV management capabilities. From breakdowns of government incentives, through to expert analysis of the cost savings you can expect with EVs.
Read the full guide or download the handy overview now.
We understand that navigating the complexities of EV purchase can be a challenge for Fleet Managers. Most states and territories in Australia have their own EV rebates to support EV adoption and corresponding eligibility criteria. We've compiled the information for your convenience.
For more in-depth information on EV adoption in Australia, check out the Electric Vehicle Council’s 2023 report on the current state of EVs across Australia.
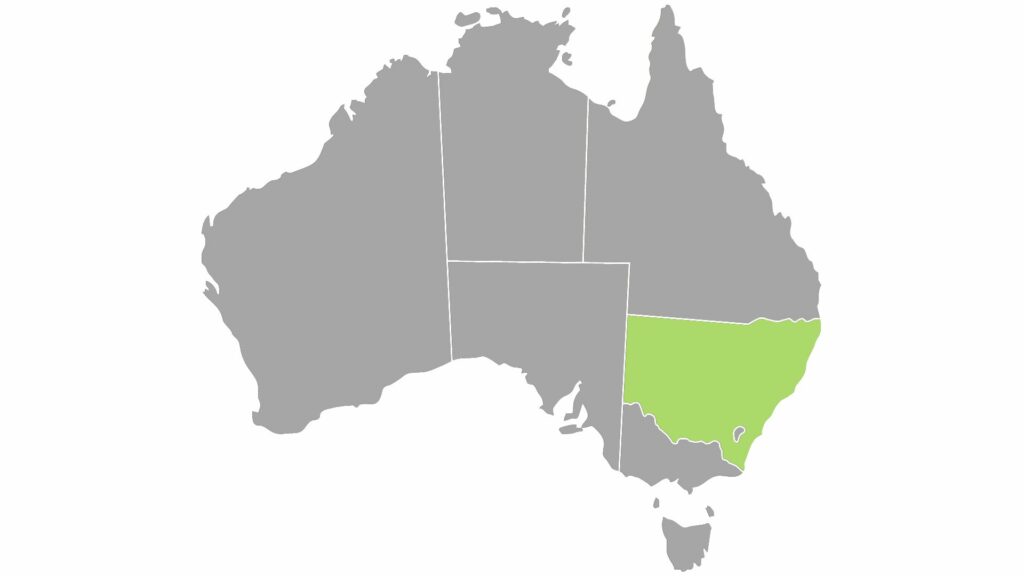
The NSW Government will offer an $3,000 EV rebate for the first 25,000 new full battery electric vehicles (BEVs) and hydrogen fuel cell electric vehicles (FCEVs), purchased for a dutiable value of less than $68,750 that are registered on or after 1 September 2021.
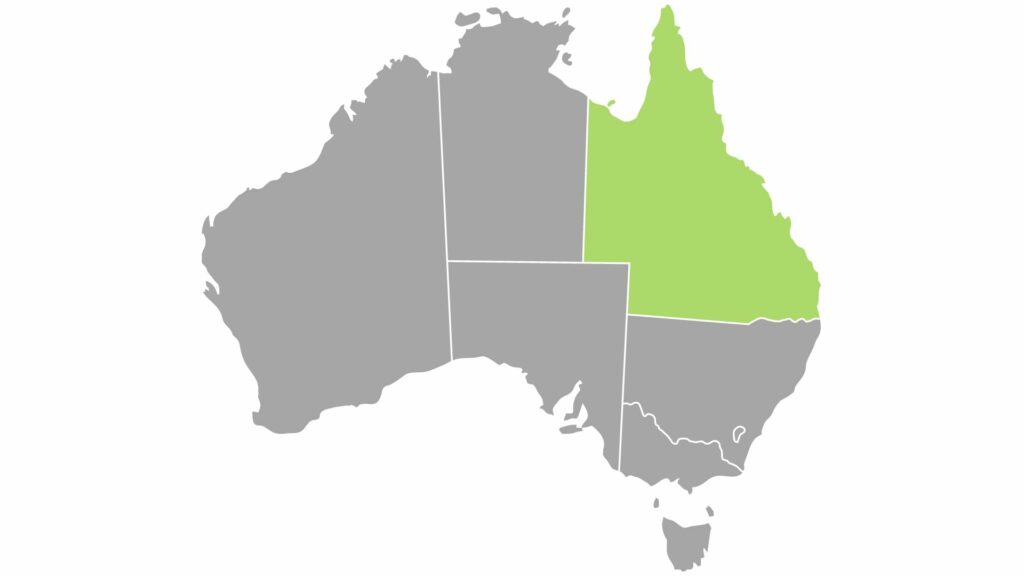
The Queensland Zero Emission Vehicle Rebate Scheme provides eligible Queenslanders rebates of up to $6,000 for eligible new Zero Emission Vehicles purchased from 21 April 2023.
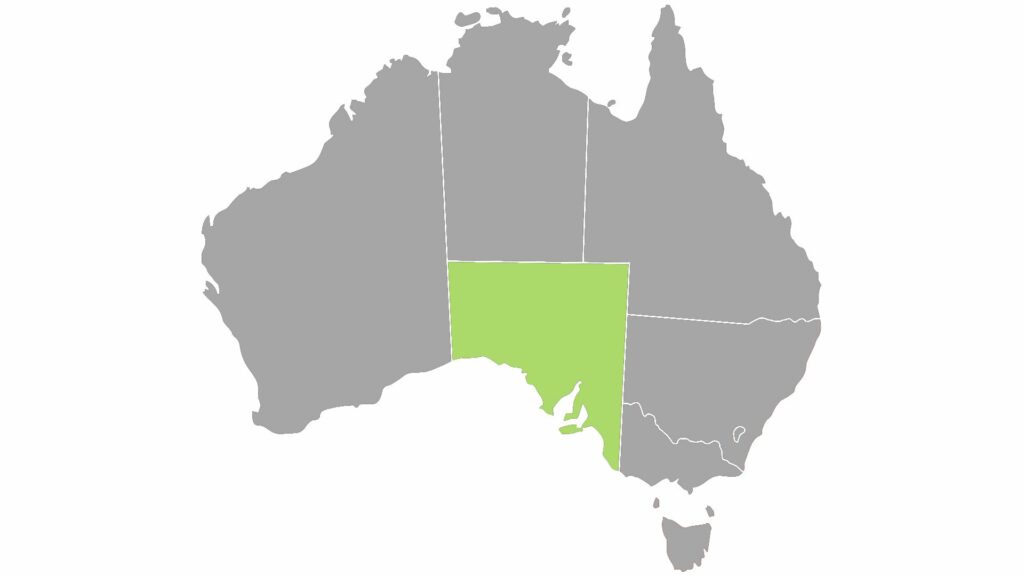
The South Australian Government is providing a $3,000 EV rebate and a 3-year registration exemption on eligible new battery electric and hydrogen fuel cell vehicles first registered from 28 October 2021.
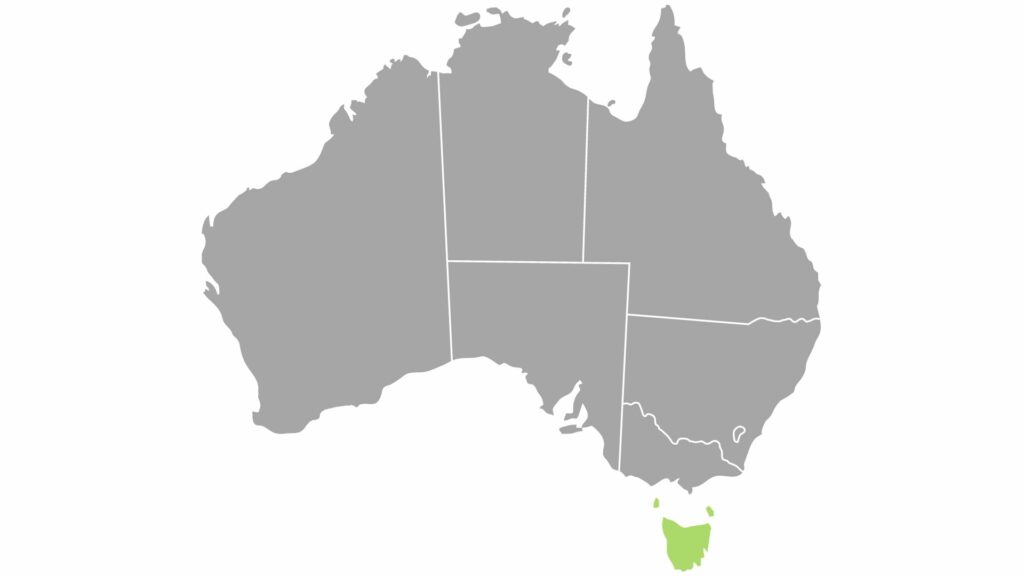
As of June 30, 2023, Tasmania’s EV rebates have ended. If you purchased an EV before May 25, 2023, you can still claim the EV and FCEV stamp duty exemption. However, this will end on January 1, 2024.
The Tasmanian Government has announced that they have plans to further incentivise EV purchases, but no information has been released.
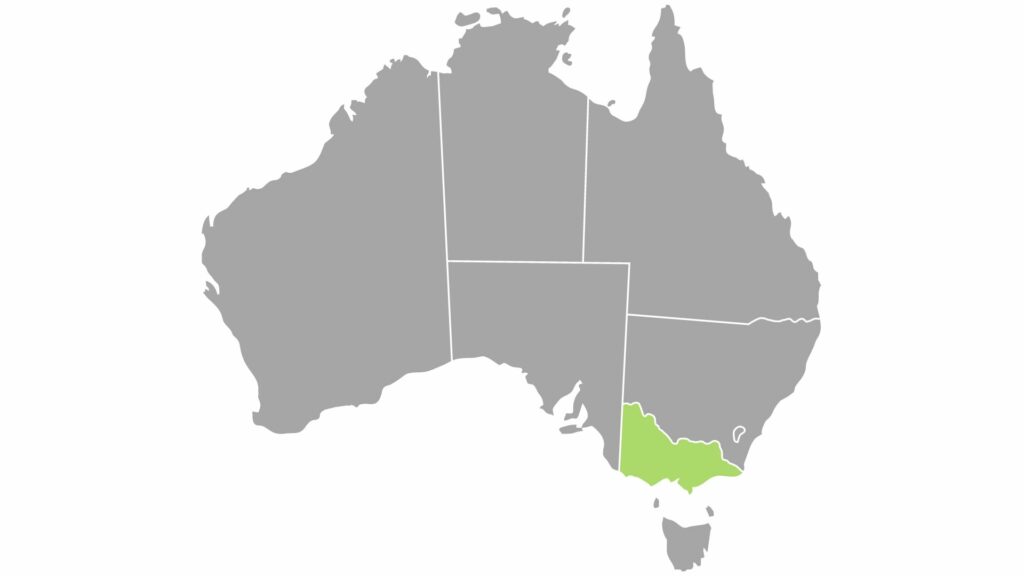
Unfortunately, the Victorian government announced in May 2023 that they were ending the $3,000 electric-car subsidy. Currently there are no plans to offer any new incentives.
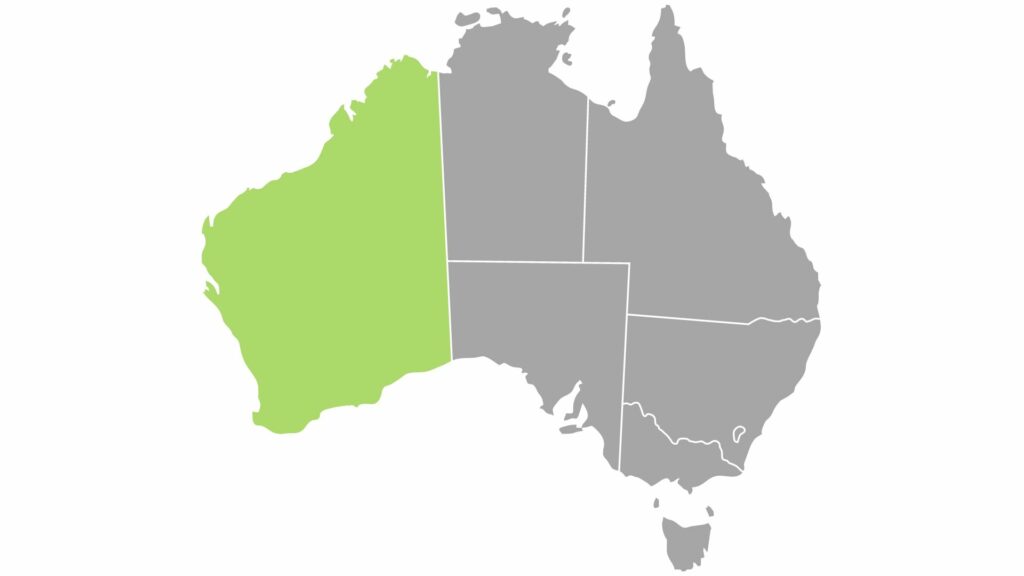
The Western Australian Government offers a $3,500 rebate on eligible ZEVs. The rebate is available for 10,000 eligible vehicles licensed in WA, or for three years following the announcement (Saturday 10 May 2025), whichever comes first.
In 2022, a Fringe Benefits Tax (FBT) exemption was introduced that removes FBT for EVs under the LCT threshold for fuel-efficient vehicles ($89,332 for the 2023-24 year). The removal of FBT effectively brings down the cost of an EV to parity with a comparable petrol or diesel car.
A list of over 30 cars that are eligible for FBT exemption has been provided, which means there is an electric car to suit most tastes:
BYD Atto 3
BYD Dolphin
Cupra Born
Cupra Leon (PHEV)
Cupra Formentor (PHEV)
Fiat 500e
Ford Escape (PHEV)
Ford Mustang Mach-e
GMW Ora
Hyundai Ioniq 5
Hyundai Ioniq 6
Hyundai Kona
Kia Niro
Kia EV6
Kia Sorento (PHEV)
Lexus ux300e
Mazda MX-30
Mercedes-Benz EQA
Mercedes-Benz EQB
Mazda CX-60 (PHEV)
Mitsubishi Outlander (PHEV)
Mitsubishi Eclipse Cross (PHEV)
MG 4
MG HS Plus (PHEV)
MG ZS EV
Mini Cooper SE
Mini Countryman (PHEV)
Nissan Leaf
Peugeot 508 (PHEV)
Peugeot 308 (PHEV)
Peugeot 3008 (PHEV)
Polestar 2
Tesla Model 3
Tesla Model Y
Volvo C40
Volvo XC40
Your Partner in EV fleet management
We understand how important it is for organisations to plan and transition to more sustainable fleets. We're keen to be your partner on the journey to sustainable transportation, and EVs will play an important role in that transition. Get in touch with us today to learn how you can get started on the journey.
These emissions, together with those being released by industry, agriculture, and energy production, have been identified as the primary cause of the severe weather conditions being experienced worldwide. Australia and New Zealand have also witnessed the effects this and are pursuing a range of measures to reduce emissions.
To achieve net zero CO2 emissions by 2050, NZ has brought in the Clean Car Discount which rewards EVs buyers and The Clean Car Standard to regulate vehicle importers and reduce CO2 emissions to specific targets. It is anticipated that these measures will work together to improve the supply and the demand for low and zero CO2 emission light vehicles entering New Zealand.
To help deliver on its goal of net zero emissions by 2050, Australia is also looking at a raft of initiatives to support EV uptake, including: Electric Car Discount legislation, which is already making EVs cheaper and Australia’s first National Electric Vehicle Charging Network, to roll out chargers on average every 150 kilometres on major highways.
It has taken a climate crisis to generate concerted action on the harm caused by internal combustion engine vehicles, but the problems caused by these vehicles reaches far beyond the weather.
According to the research in NZ, transport is responsible for two thirds of the harm estimated to be caused by human-made air pollution. Each year in New Zealand harmful emissions result in:
The premature deaths of more than 2,200 adult New Zealanders
More than 9,200 hospital admissions for respiratory and cardiac illnesses
For context, road accidents across Australia in 2021 resulted in 1,123 premature deaths – that is 10 times less than the number of deaths resulting from air pollution.
This is because, in addition to greenhouse gases, petrol and diesel vehicles also release nitrogen oxides and particulate pollution that are harmful to our health. Exposure to nitrogen oxides causes respiratory and cardiovascular damage and can contribute to smog. Particulates can cause lung cancer, and both forms of pollution contribute to asthma.
We could be forgiven for thinking that removing lead from petrol (1996 in NZ and 2002 in Australia) eliminated the major health-harm effects of vehicle pollution, but the problems have continued. Looking at the statistics for pollution harm in NZ and Australia provides further support for switching to EVs, beyond improving the health of the planet.
While the purchase price is one thing to consider when investing in fleet vehicles, it’s also important to look at the total cost of owning an EV, compared to a petrol (or diesel) vehicle. Total cost of ownership is a calculation that adds up all the costs related to buying and operating the vehicle, and then subtracts the residual value of the vehicle (the price it can be sold for).
Research indicates that the total cost of owning an EV is significantly less than owning a petrol car. This is because BEV engines are much simpler than internal combustion engines, with fewer moving parts, which means maintenance is far less expensive. There is no need to tune the engine, change the oil, replace the spark plugs, or service the transmission.
One study found electric vehicle servicing costs are one-third lower than ICE servicing costs. Based on this assumption, you might spend $1,000 maintaining a petrol engine each year or $666 to maintain a BEV. (Hybrid vehicles still have an ICE engine, so servicing costs won’t be much lower, if at all.)
In another study, the average total cost of ownership for the four tested EVswas 67.5% of the total cost of owning the petrol alternatives, at $36,772 for the EVs compared to $54,473 for the petrol cars. The real-world evidence is stacking up in favour of EVs and we haven’t even mentioned burning expensive fossil fuels.
Using electricity to power your car, instead of petrol is a major saving.
Of course, the total cost of ownership needs to include any future resale price to be truly representative, and EV ownership is looking good there, too. The EVs looked at in this studyhad a higher residual value after five years of ownership, whereas the petrol vehicles generally lost value faster. After five years, the four tested EVs could be expected to sell for, on average, 50% of their original purchase price. The petrol cars, on the other hand, had expectations, on average, that were 43% of their original purchase price.