Uncovering insights about how your fleet is performing is one of the hardest tasks a Fleet Manager has. Without the use of asset tracking, you have no way to track your fleet’s daily, weekly, monthly, and annual usage. Without effective reporting tools, diving into the data and picking apart how your fleet is truly performing is a challenge. While Smartrak has a wide range of reports that Fleet Managers rely on day in and day out, we realise there is often a need to streamline the process of fleet reporting.
That’s where our new Insights Reports come in.
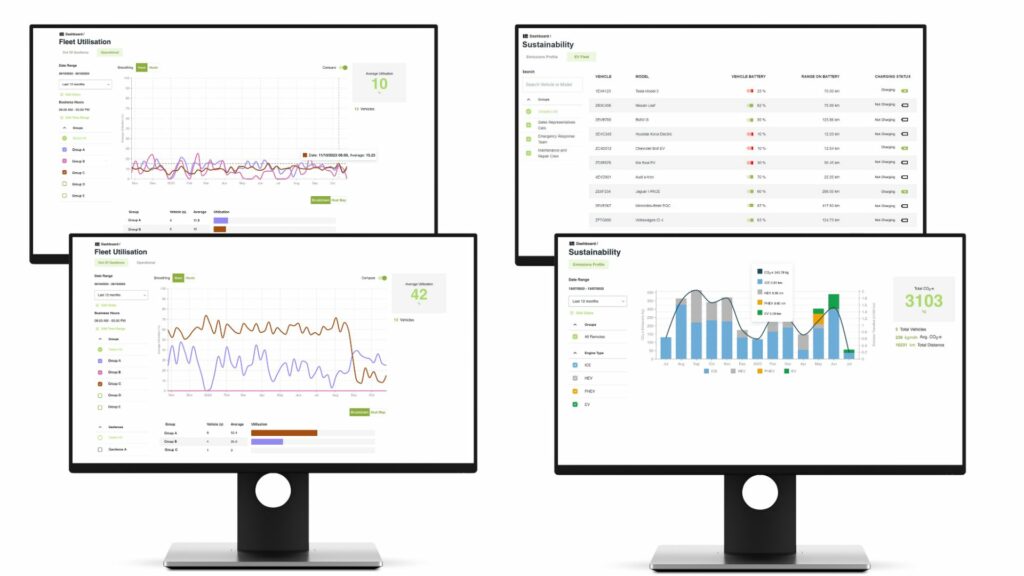
Insights Reports have been specifically developed for Fleet Managers to monitor and optimise the efficiency of their fleets. They offer an alternative to crunching data in spreadsheets via a streamlined and interactive experience that makes analysing fleet data a breeze.
Currently there are four insights reports available, and two dedicated to analysing fleet utilisation: Out of Geofence Utilisation and Operational Utilisation. The two utilisation reports complement each other and deliver exceptional visibility over fleet operations.
Out of Geofence Utilisation overview
Out of Geofence Utilisation is the first Insight report that Fleet Managers will want to check. The report leverages the geofence capabilities baked into the Smartrak map and measures the time that vehicles and assets spend outside of their ‘home’ geofence. This Insight Report provides a great first step in understanding how your fleet is being used on a daily, weekly, or monthly basis.
Operational Utilisation Overview
Operational Utilisation is the next step that Fleet Managers should take when undertaking a detailed analysis of their fleet’s utilisation. Unlike Out of Geofence Utilisation, Operational Utilisation is based on the time a vehicle’s engine is in operation: highlighting when a vehicle is actually in use, rather than parked up.
Before we dive into how to leverage the new Insights Utilisation Reports, we thought it would be worth doing an overview of the various reporting features and how you can use these to gain the insights that are important to your operations.
Date ranges and business hours
We support a lot of 24/7 organisations such as Hospitals and Emergency Services. However, most businesses only need to analyse a set of core business hours. The date range and business hours function gives users the ability to narrow the data view in order to focus on only the time ranges that are relevant.
Groups
Assets in Smartrak are often grouped together for reporting purposes. This could be due to vehicles being based at a specific location or ‘home’ geofence. This feature provides the ability to filter only the groups that you want to focus on. Unchecking certain groups will remove them from the report although they can be added back at any time.
Utilisation Graph
Where the magic happens. This graph will display fleet, group, or vehicle utilisation based on the parameters and filters chosen. The figure to the right shows the overall utilisation as a percentage across the selected timeframe.
Group Breakdown
Do you need to know more about the makeup of a specific group? Select the required group to break it down into its constituent parts.
Heat Map
A secondary visual representation of utilisation that graphically illustrates tends. Darker colours represent higher utilisation, while lighter colours represent lower utilisation.
Compare Groups / Vehicles
Flicking this toggle will allow you to compare the aspect of the fleet you are focussed on against a different date range or time period, group or vehicle.
Smoothing
This option gives you the ability to smooth out individual data points. This is especially useful for longer time periods, where separate data points will appear as noise, making analysis difficult.
Let’s work through an actual scenario so you can see the power of these reports in action.
Say you’re a Fleet Manager who’s been tasked with reporting on vehicle utilisation and you want to tell a compelling story about how the fleet is being used. This will entail not only data but the insights that illustrate how the fleet is actually performing.
The first port of call would be to run the Out of Geofence Insight Report and set the date range for a suitable time period. In the example image, we’ve chosen a twelve-month period.
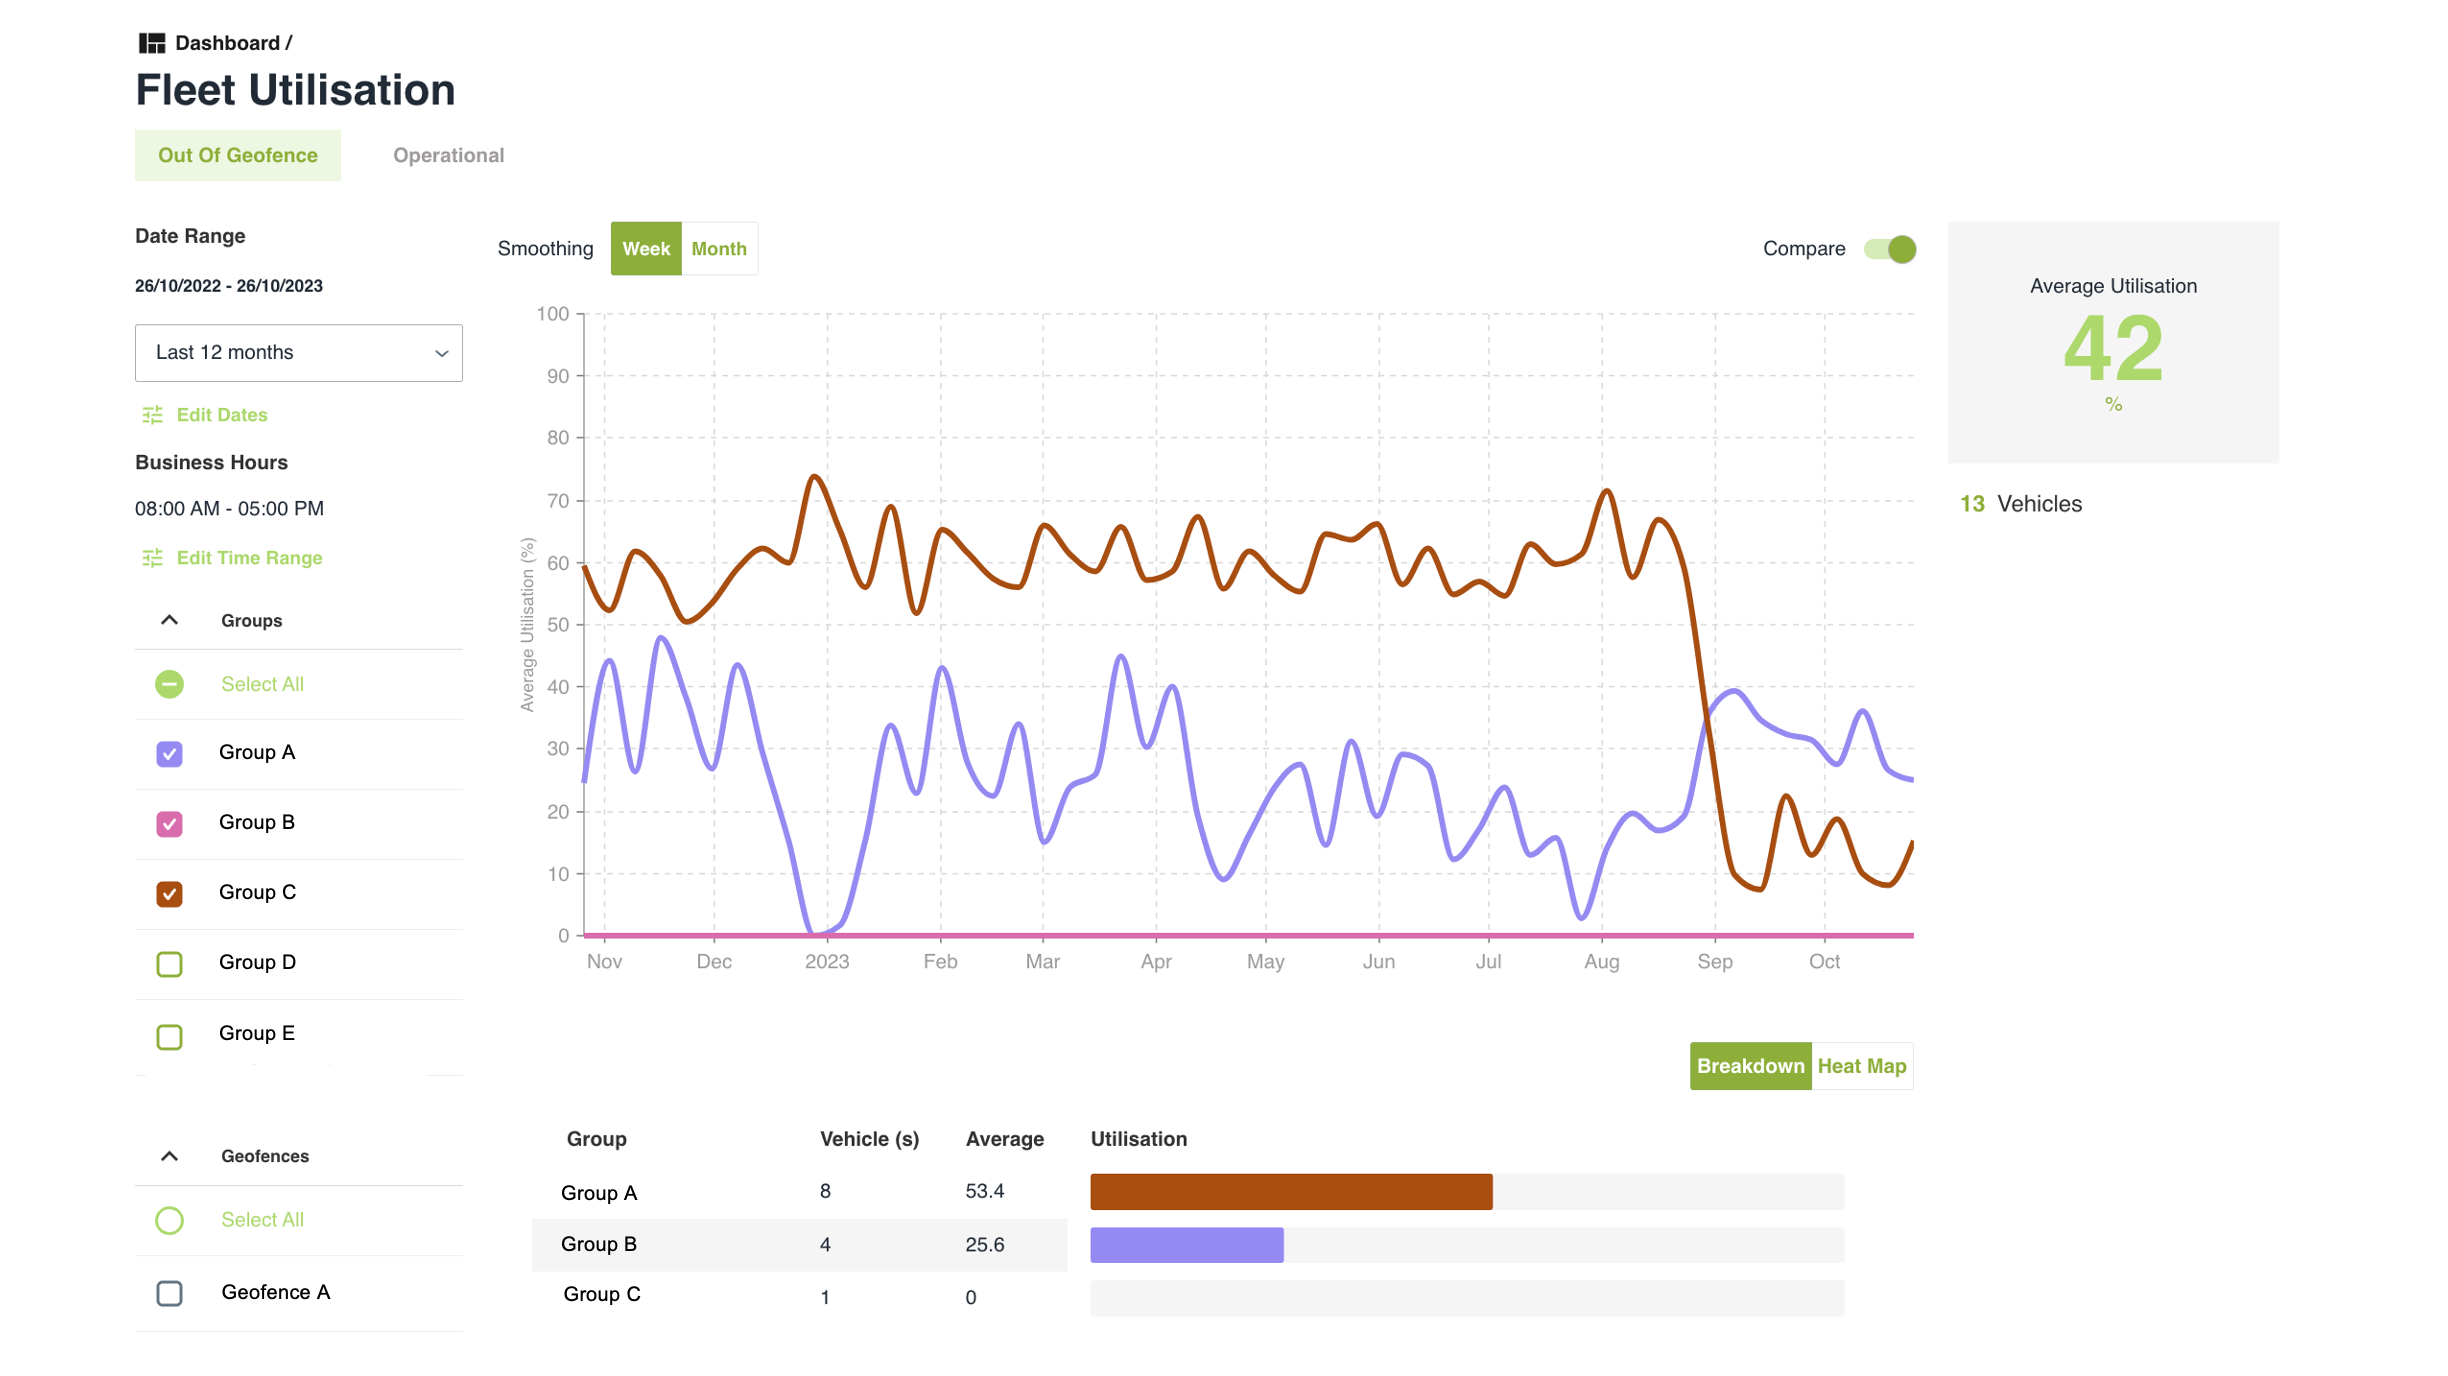
You have decided to drill down into a couple of groups, each with a different number of vehicles. You have also filtered your organisation’s business hours (8am to 5pm) and selected weekly smoothing so you can still see fluctuations in the utilisation. Once the report has refreshed, you see straight away that your average utilisation is sitting at 42%. Great work.
There are, however, a couple of areas of concern. Group A’s utilisation has dropped significantly in the last two months. It was fluctuating between 55% and 65% but has plummeted to between 10% and 20%. What happened in September to impact fleet usage?
Group B has hovered around an average of 20% - 40% for the whole 12-month period. There are four vehicles, so there could be an opportunity to shift one vehicle somewhere else and improve overall utilisation rates. But this depends on how the vehicles are being used; more information is required (the Operational Utilisation Report will be just the place to find it).
Furthermore, Group C has registered 0% utilisation across the entire year. While It’s only a single vehicle, if no one’s using it, there may be other areas of the business that could take advantage of that asset, or is this an opportunity to de-fleet the vehicle and lower the fleet’s overall operating costs? Afterall, fuel, maintenance, registration, and insurance are significant and unnecessary overheads for an asset that hasn’t been touched in 12 months.
This is all good information, but it’s not the end of the story.
Next, it’s worth diving into the Operational Utilisation Report, for more granular detail as this report monitors actual vehicle running time. You’ll soon see that this measure of vehicle activity provides a different perspective.
In the Operational Utilisation Report the average operational utilisation is only 10%. What’s going on?
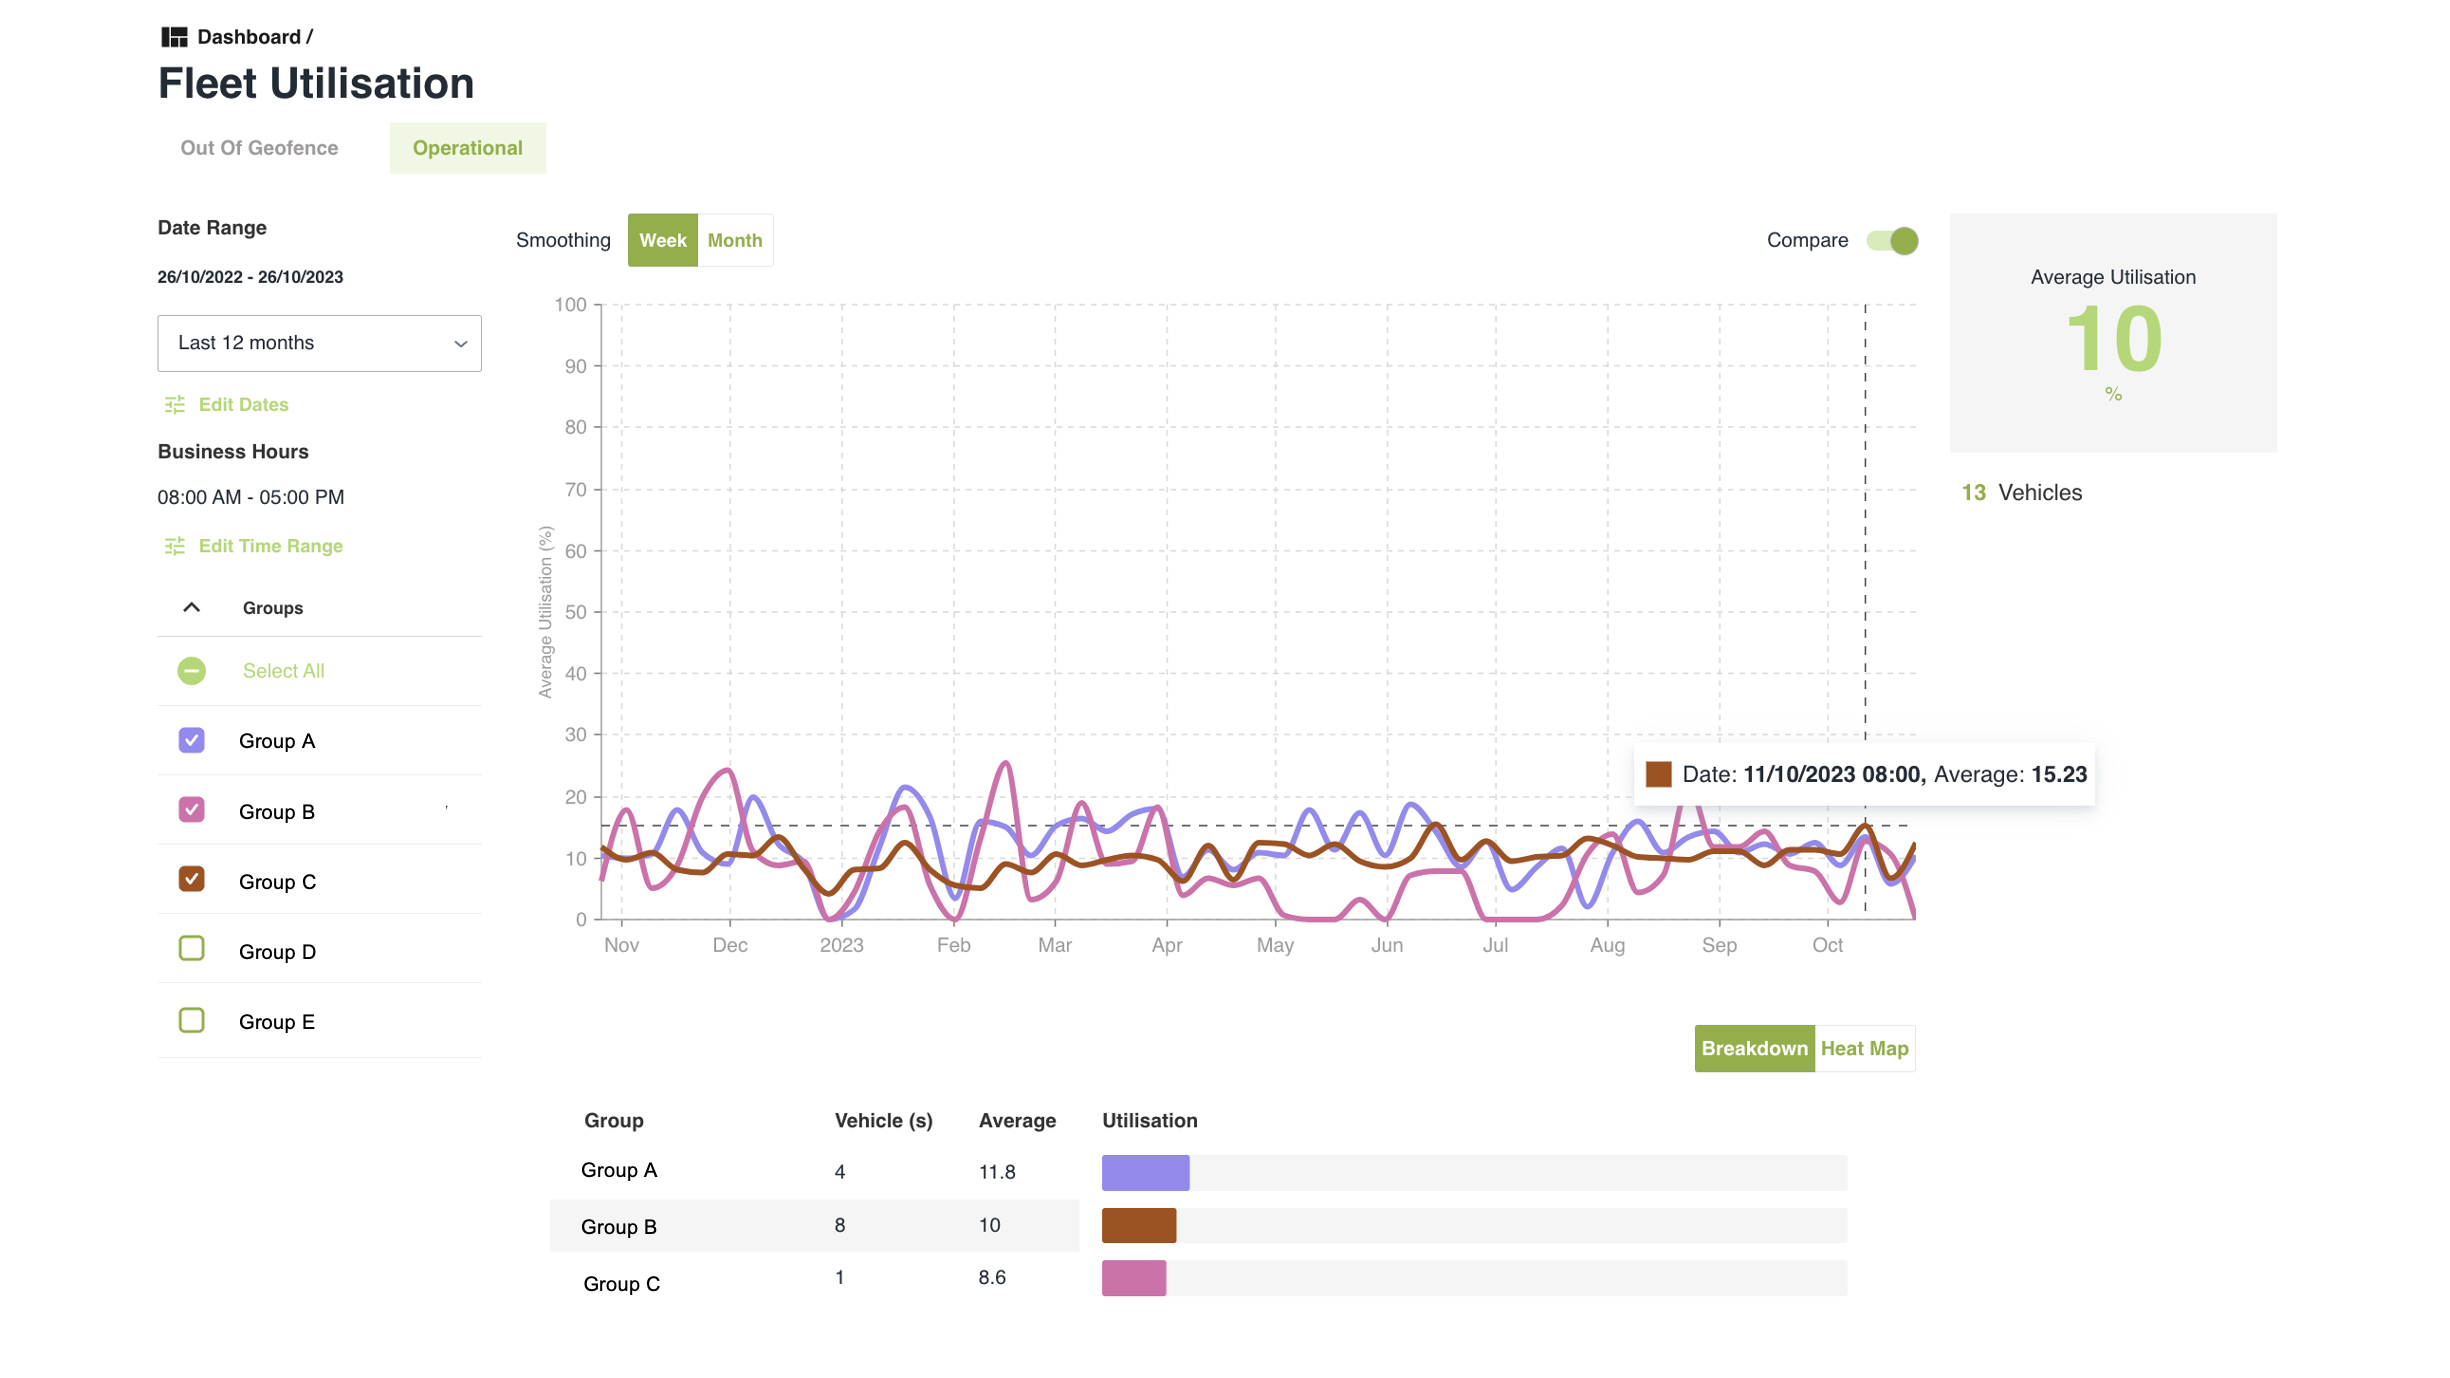
Group A still has the highest utilisation, but not by much. What you’re discovering here is that Group A vehicles are exiting the geofence but not being driven for the majority of the time they are outside the geofence. This is causing the fleet’s overall utilisation rate to fall. Is this insight highlighting an opportunity better use vehicles; perhaps a single vehicle transporting two teams to different tasks could be the solution?
Surprisingly, Group C is edging close to 10% utilisation. How can that be? Because the vehicle hasn’t triggered a geofence exit / entry event, the only answer is that the vehicle is being used exclusively inside it’s home geofence. If the home geofence encompasses a large campus, 10% utilisation could denote a vehicle that’s used for transporting people or materials from one department to another. Further investigation may show that three or four e-Bikes would be a more appropriate solution – saving operational costs and reducing emissions.
Heatmaps for further analysis
Both reports also show a heatmap of when each vehicle or group of vehicles is in use. This can be used to quickly identify utilisation bottlenecks and periods of peak activity.
Hint: don’t aim for 100%
Utilisation is never going to be 100% for any fleet and for vehicles with specific tasks such as breakdown recovery utilisation rates could be very low. Our recommendation is that Operational Utilisation rates in single digits generally highlight a need to dig deeper. This could involve assessing operations, the fleet’s size and possibly its make up.
Sustainable Transportation
Understanding Operational Utilisation based on driving time directly correlates to environmental impact. By optimising each vehicle's driving time, fleet managers can reduce the fleet's overall carbon footprint, contributing to greener and more sustainable transportation solutions (and cost savings). When a fleet is operating efficiently it’s burning less fuel and reducing emissions.
While optimised operations will support your move to a more sustainable fleet, it’s adopting EVs that will deliver the big gains. Often, a fleet will bring in the number of EVs it feels can be accommodated within existing operations. This number will depend on a range of factors including range requirements and the investment required for charging infrastructure. By investigating both the Geofence and Operational Utilisation reports Fleet Managers can gain the insights to make EV adoption decisions based on actual data. Knowing when vehicles are within the home geofence highlights opportunities to plug EVs into chargers, to extend the utilisation window. These insights can also inform your charger infrastructure strategy, to avoid over-investment in chargers.
Data-driven Decision Making
The graphical reporting insights from driving time enable managers to make informed decisions related to fleet management, such as optimal scheduling and targeted maintenance based on actual usage. This ensures resources are utilised efficiently and minimises wasteful practices.
Decision making based on Insights Reports will also reduce the time it takes to progress new ideas. These reports are designed for sharing so various departments can be brought up to speed on what’s happening in the fleet and armed with the knowledge to contribute to effective decision making. The data is also presented in a way that will greatly improve the value and clarity of project overviews and business cases, without adding extra workload.
Performance Analysis & Future Strategy
Fleet managers commonly state that there isn’t enough time for them to devote to strategy planning. This is where Insights Reports can be a significant help. The portfolio of functions that you can bring to the analysis of a wide range of fleet activities enables quick reviews and comparisons to aid analysis without resorting to different reports and trying to compare your results. This functionality can be your weekly or monthly management toolkit, allowing you to refine operations for best result or to plan for the advances you can see in fleet efficiency.
Start using Insights Reports and quickly discover that it’s essential for ensuring the fleet aligns with business needs and is positioned for delivering high standards of service. Plus, you’re using a reporting platform that’s designed to support future thinking. Smartrak’s development pathway for Insights Reports includes more ways to look at utilisation, new reports on driver behaviours, and an expanding platform of fleet sustainability tools that will be pivotal for shaping your future-fleet strategies.